Hungarian vs Immigrants from Eritrea Unemployment Among Ages 16 to 19 years
COMPARE
Hungarian
Immigrants from Eritrea
Unemployment Among Ages 16 to 19 years
Unemployment Among Ages 16 to 19 years Comparison
Hungarians
Immigrants from Eritrea
17.1%
UNEMPLOYMENT AMONG AGES 16 TO 19 YEARS
91.6/ 100
METRIC RATING
119th/ 347
METRIC RANK
17.3%
UNEMPLOYMENT AMONG AGES 16 TO 19 YEARS
81.1/ 100
METRIC RATING
139th/ 347
METRIC RANK
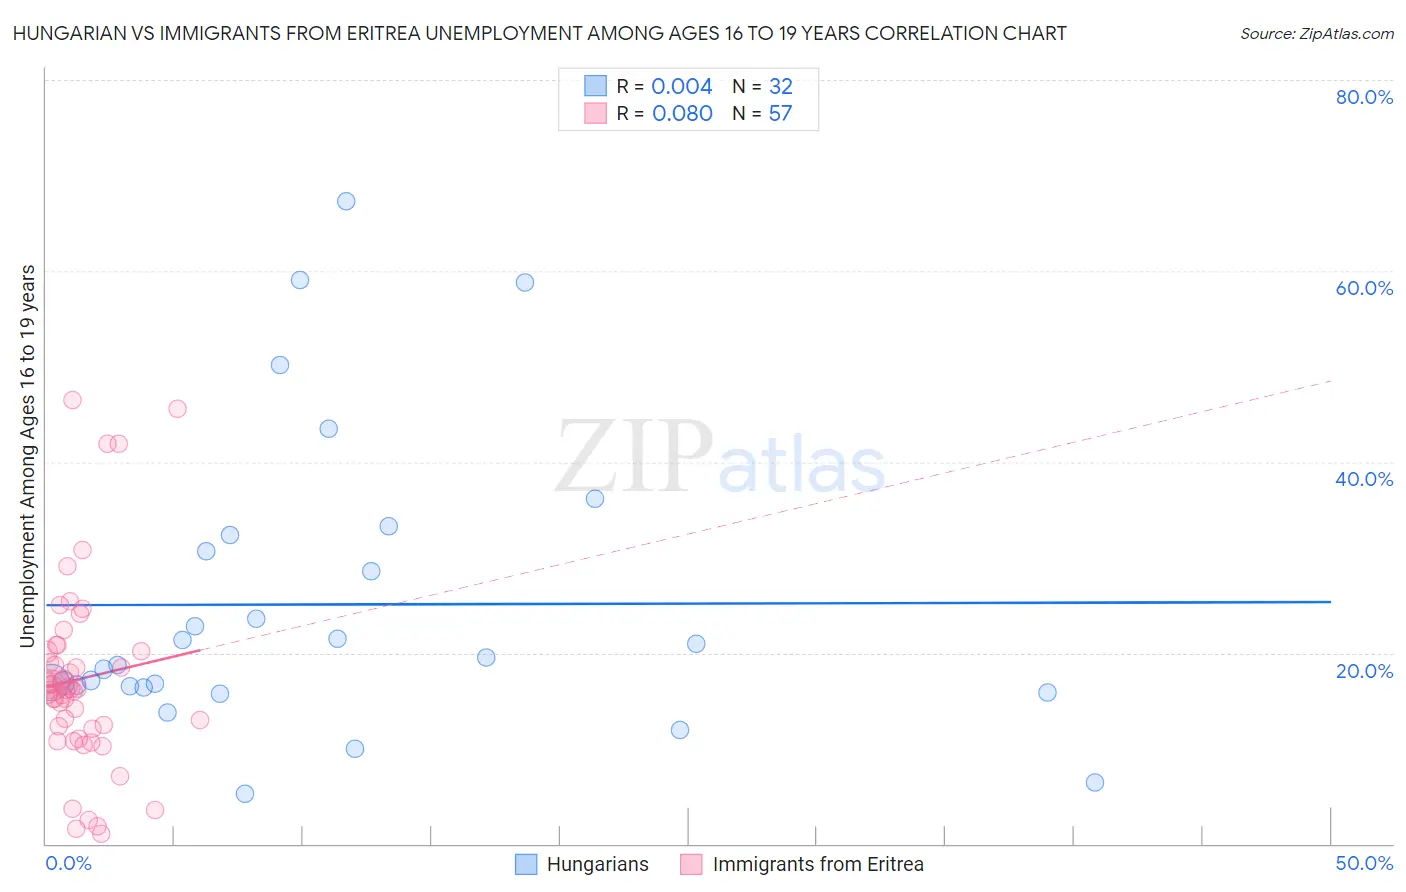
Hungarian vs Immigrants from Eritrea Unemployment Among Ages 16 to 19 years Correlation Chart
The statistical analysis conducted on geographies consisting of 448,171,361 people shows no correlation between the proportion of Hungarians and unemployment rate among population between the ages 16 and 19 in the United States with a correlation coefficient (R) of 0.004 and weighted average of 17.1%. Similarly, the statistical analysis conducted on geographies consisting of 103,486,787 people shows a slight positive correlation between the proportion of Immigrants from Eritrea and unemployment rate among population between the ages 16 and 19 in the United States with a correlation coefficient (R) of 0.080 and weighted average of 17.3%, a difference of 1.1%.
Unemployment Among Ages 16 to 19 years Correlation Summary
| Measurement | Hungarian | Immigrants from Eritrea |
| Minimum | 5.2% | 1.1% |
| Maximum | 67.3% | 46.5% |
| Range | 62.1% | 45.4% |
| Mean | 25.1% | 17.3% |
| Median | 19.1% | 16.2% |
| Interquartile 25% (IQ1) | 16.4% | 12.2% |
| Interquartile 75% (IQ3) | 31.5% | 20.1% |
| Interquartile Range (IQR) | 15.0% | 7.9% |
| Standard Deviation (Sample) | 15.5% | 9.8% |
| Standard Deviation (Population) | 15.2% | 9.7% |
Demographics Similar to Hungarians and Immigrants from Eritrea by Unemployment Among Ages 16 to 19 years
In terms of unemployment among ages 16 to 19 years, the demographic groups most similar to Hungarians are Immigrants from Middle Africa (17.1%, a difference of 0.11%), Immigrants from Moldova (17.1%, a difference of 0.13%), Immigrants from South Eastern Asia (17.1%, a difference of 0.14%), Immigrants from Laos (17.1%, a difference of 0.39%), and Syrian (17.1%, a difference of 0.41%). Similarly, the demographic groups most similar to Immigrants from Eritrea are Bolivian (17.3%, a difference of 0.070%), Immigrants from Malaysia (17.2%, a difference of 0.14%), Immigrants from Oceania (17.2%, a difference of 0.16%), Potawatomi (17.2%, a difference of 0.22%), and Samoan (17.2%, a difference of 0.22%).
| Demographics | Rating | Rank | Unemployment Among Ages 16 to 19 years |
| Hungarians | 91.6 /100 | #119 | Exceptional 17.1% |
| Immigrants | Middle Africa | 90.9 /100 | #120 | Exceptional 17.1% |
| Immigrants | Moldova | 90.7 /100 | #121 | Exceptional 17.1% |
| Immigrants | South Eastern Asia | 90.7 /100 | #122 | Exceptional 17.1% |
| Immigrants | Laos | 88.8 /100 | #123 | Excellent 17.1% |
| Syrians | 88.6 /100 | #124 | Excellent 17.1% |
| Immigrants | Germany | 87.7 /100 | #125 | Excellent 17.2% |
| Immigrants | Bolivia | 86.7 /100 | #126 | Excellent 17.2% |
| Pakistanis | 85.8 /100 | #127 | Excellent 17.2% |
| Australians | 85.6 /100 | #128 | Excellent 17.2% |
| Creek | 85.5 /100 | #129 | Excellent 17.2% |
| Immigrants | Indonesia | 84.7 /100 | #130 | Excellent 17.2% |
| German Russians | 84.1 /100 | #131 | Excellent 17.2% |
| Arabs | 83.9 /100 | #132 | Excellent 17.2% |
| Laotians | 83.9 /100 | #133 | Excellent 17.2% |
| Potawatomi | 83.8 /100 | #134 | Excellent 17.2% |
| Samoans | 83.7 /100 | #135 | Excellent 17.2% |
| Immigrants | Oceania | 83.1 /100 | #136 | Excellent 17.2% |
| Immigrants | Malaysia | 82.8 /100 | #137 | Excellent 17.2% |
| Bolivians | 81.9 /100 | #138 | Excellent 17.3% |
| Immigrants | Eritrea | 81.1 /100 | #139 | Excellent 17.3% |