Bhutanese vs Spanish American Indian Female Unemployment
COMPARE
Bhutanese
Spanish American Indian
Female Unemployment
Female Unemployment Comparison
Bhutanese
Spanish American Indians
4.9%
FEMALE UNEMPLOYMENT
98.7/ 100
METRIC RATING
59th/ 347
METRIC RANK
6.2%
FEMALE UNEMPLOYMENT
0.0/ 100
METRIC RATING
305th/ 347
METRIC RANK
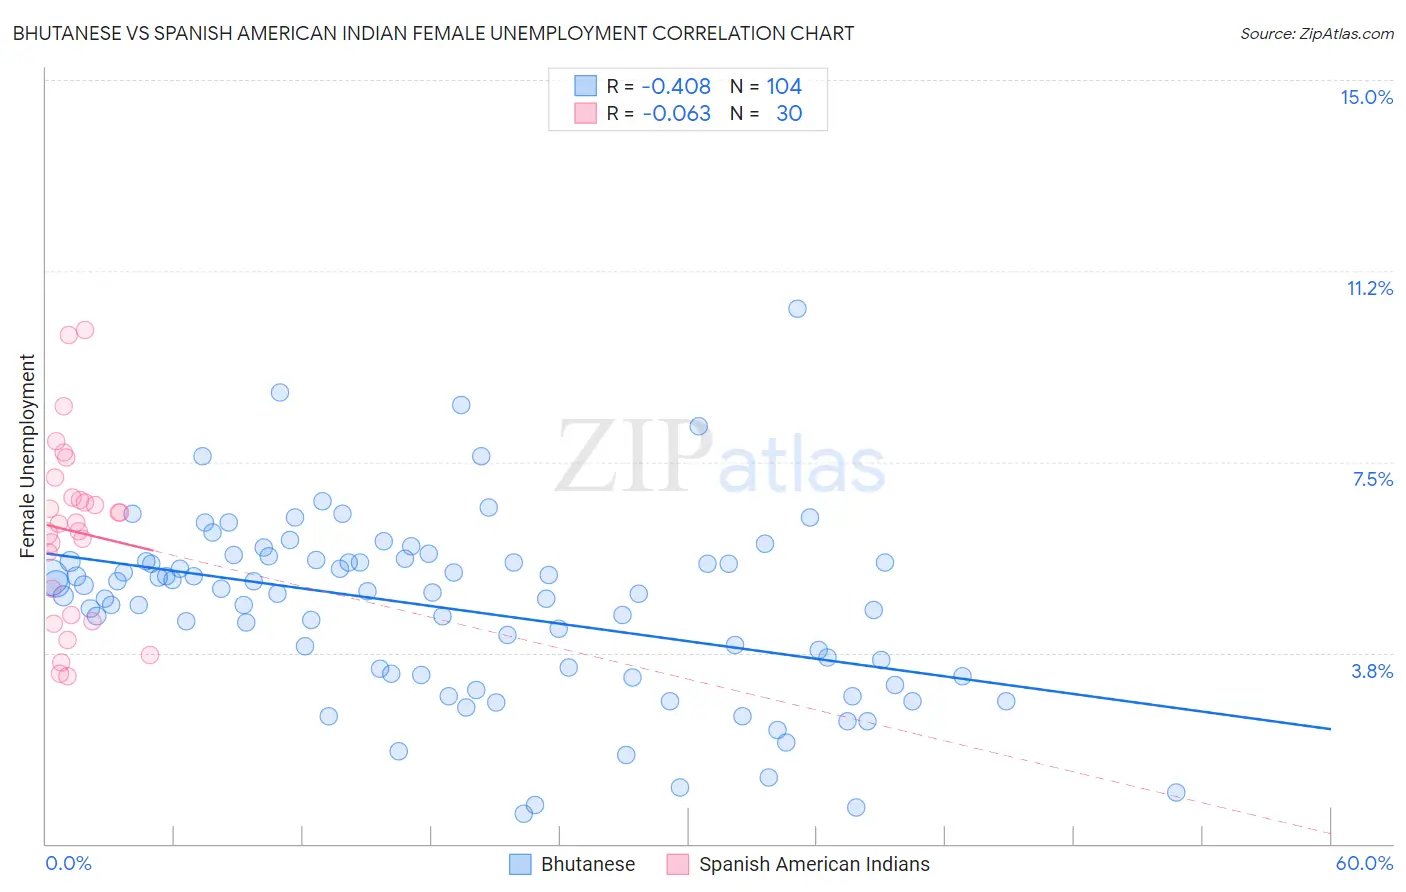
Bhutanese vs Spanish American Indian Female Unemployment Correlation Chart
The statistical analysis conducted on geographies consisting of 452,429,173 people shows a moderate negative correlation between the proportion of Bhutanese and unemploymnet rate among females in the United States with a correlation coefficient (R) of -0.408 and weighted average of 4.9%. Similarly, the statistical analysis conducted on geographies consisting of 73,075,027 people shows a slight negative correlation between the proportion of Spanish American Indians and unemploymnet rate among females in the United States with a correlation coefficient (R) of -0.063 and weighted average of 6.2%, a difference of 26.4%.
Female Unemployment Correlation Summary
| Measurement | Bhutanese | Spanish American Indian |
| Minimum | 0.60% | 3.3% |
| Maximum | 10.5% | 10.1% |
| Range | 9.9% | 6.8% |
| Mean | 4.6% | 6.1% |
| Median | 4.9% | 6.3% |
| Interquartile 25% (IQ1) | 3.3% | 4.5% |
| Interquartile 75% (IQ3) | 5.5% | 6.8% |
| Interquartile Range (IQR) | 2.2% | 2.3% |
| Standard Deviation (Sample) | 1.8% | 1.8% |
| Standard Deviation (Population) | 1.8% | 1.7% |
Similar Demographics by Female Unemployment
Demographics Similar to Bhutanese by Female Unemployment
In terms of female unemployment, the demographic groups most similar to Bhutanese are Immigrants from Scotland (4.9%, a difference of 0.080%), Immigrants from Canada (4.9%, a difference of 0.090%), Immigrants from Nepal (4.9%, a difference of 0.090%), Immigrants from Lithuania (4.9%, a difference of 0.12%), and Immigrants from Belgium (4.9%, a difference of 0.20%).
| Demographics | Rating | Rank | Female Unemployment |
| Slavs | 99.1 /100 | #52 | Exceptional 4.9% |
| Whites/Caucasians | 99.0 /100 | #53 | Exceptional 4.9% |
| Immigrants | Zimbabwe | 99.0 /100 | #54 | Exceptional 4.9% |
| Immigrants | Moldova | 99.0 /100 | #55 | Exceptional 4.9% |
| Serbians | 99.0 /100 | #56 | Exceptional 4.9% |
| Icelanders | 98.8 /100 | #57 | Exceptional 4.9% |
| Immigrants | Lithuania | 98.8 /100 | #58 | Exceptional 4.9% |
| Bhutanese | 98.7 /100 | #59 | Exceptional 4.9% |
| Immigrants | Scotland | 98.6 /100 | #60 | Exceptional 4.9% |
| Immigrants | Canada | 98.6 /100 | #61 | Exceptional 4.9% |
| Immigrants | Nepal | 98.6 /100 | #62 | Exceptional 4.9% |
| Immigrants | Belgium | 98.5 /100 | #63 | Exceptional 4.9% |
| Celtics | 98.5 /100 | #64 | Exceptional 4.9% |
| Immigrants | North America | 98.3 /100 | #65 | Exceptional 4.9% |
| Hungarians | 98.3 /100 | #66 | Exceptional 4.9% |
Demographics Similar to Spanish American Indians by Female Unemployment
In terms of female unemployment, the demographic groups most similar to Spanish American Indians are Immigrants from Jamaica (6.2%, a difference of 0.060%), Immigrants from Central America (6.2%, a difference of 0.16%), Shoshone (6.2%, a difference of 0.17%), Hispanic or Latino (6.2%, a difference of 0.23%), and Barbadian (6.2%, a difference of 0.42%).
| Demographics | Rating | Rank | Female Unemployment |
| Jamaicans | 0.0 /100 | #298 | Tragic 6.1% |
| Ute | 0.0 /100 | #299 | Tragic 6.1% |
| Immigrants | Haiti | 0.0 /100 | #300 | Tragic 6.1% |
| Immigrants | Barbados | 0.0 /100 | #301 | Tragic 6.2% |
| U.S. Virgin Islanders | 0.0 /100 | #302 | Tragic 6.2% |
| Barbadians | 0.0 /100 | #303 | Tragic 6.2% |
| Immigrants | Jamaica | 0.0 /100 | #304 | Tragic 6.2% |
| Spanish American Indians | 0.0 /100 | #305 | Tragic 6.2% |
| Immigrants | Central America | 0.0 /100 | #306 | Tragic 6.2% |
| Shoshone | 0.0 /100 | #307 | Tragic 6.2% |
| Hispanics or Latinos | 0.0 /100 | #308 | Tragic 6.2% |
| Ecuadorians | 0.0 /100 | #309 | Tragic 6.3% |
| Central American Indians | 0.0 /100 | #310 | Tragic 6.3% |
| Immigrants | Mexico | 0.0 /100 | #311 | Tragic 6.3% |
| Immigrants | Grenada | 0.0 /100 | #312 | Tragic 6.3% |