Bhutanese vs Korean Female Unemployment
COMPARE
Bhutanese
Korean
Female Unemployment
Female Unemployment Comparison
Bhutanese
Koreans
4.9%
FEMALE UNEMPLOYMENT
98.7/ 100
METRIC RATING
59th/ 347
METRIC RANK
5.4%
FEMALE UNEMPLOYMENT
13.4/ 100
METRIC RATING
209th/ 347
METRIC RANK
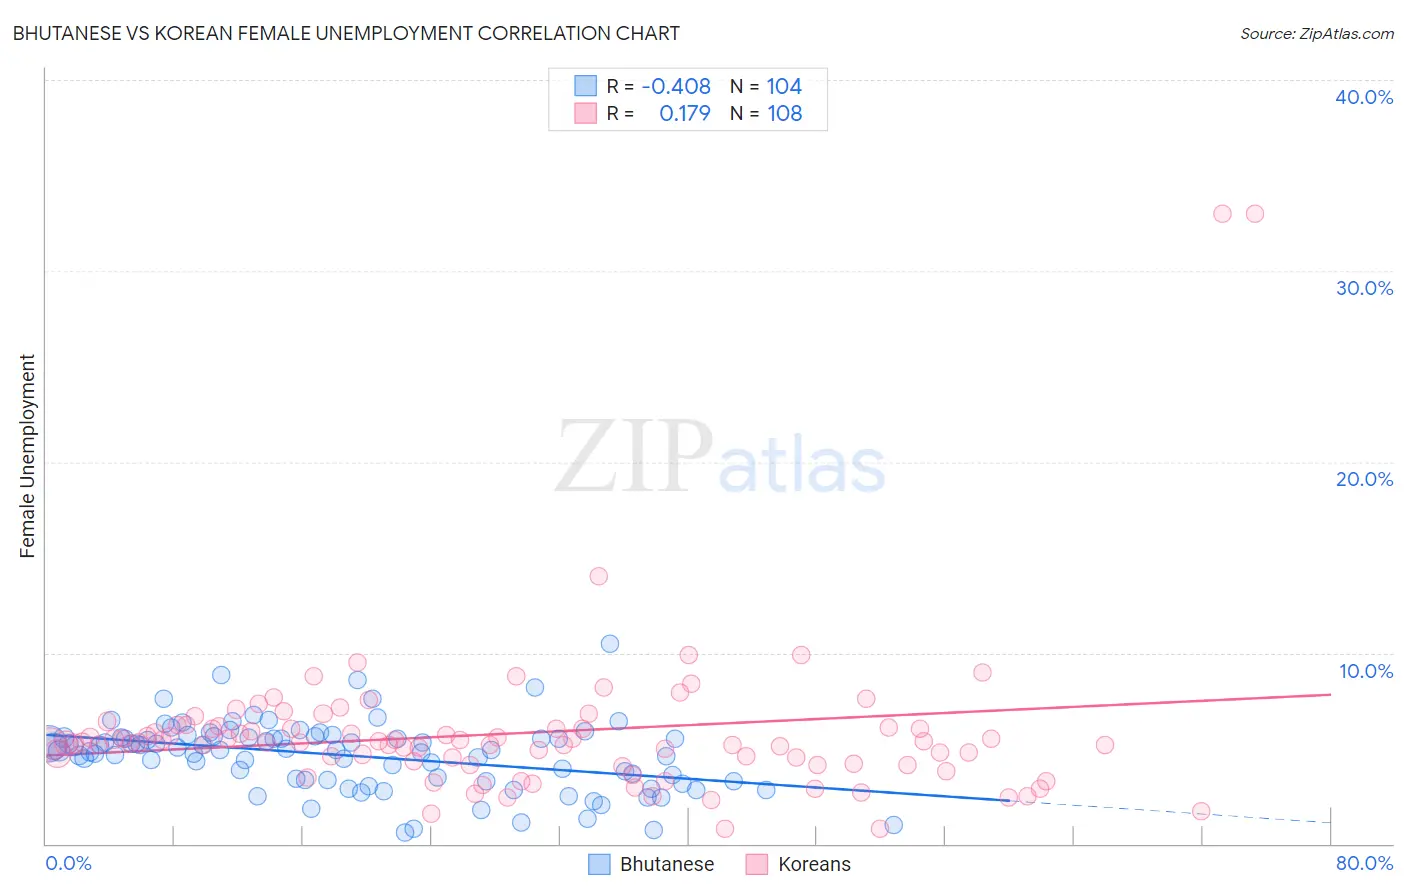
Bhutanese vs Korean Female Unemployment Correlation Chart
The statistical analysis conducted on geographies consisting of 452,429,173 people shows a moderate negative correlation between the proportion of Bhutanese and unemploymnet rate among females in the United States with a correlation coefficient (R) of -0.408 and weighted average of 4.9%. Similarly, the statistical analysis conducted on geographies consisting of 506,042,019 people shows a poor positive correlation between the proportion of Koreans and unemploymnet rate among females in the United States with a correlation coefficient (R) of 0.179 and weighted average of 5.4%, a difference of 9.9%.
Female Unemployment Correlation Summary
| Measurement | Bhutanese | Korean |
| Minimum | 0.60% | 0.80% |
| Maximum | 10.5% | 33.0% |
| Range | 9.9% | 32.2% |
| Mean | 4.6% | 5.8% |
| Median | 4.9% | 5.3% |
| Interquartile 25% (IQ1) | 3.3% | 4.2% |
| Interquartile 75% (IQ3) | 5.5% | 6.1% |
| Interquartile Range (IQR) | 2.2% | 1.9% |
| Standard Deviation (Sample) | 1.8% | 4.3% |
| Standard Deviation (Population) | 1.8% | 4.2% |
Similar Demographics by Female Unemployment
Demographics Similar to Bhutanese by Female Unemployment
In terms of female unemployment, the demographic groups most similar to Bhutanese are Immigrants from Scotland (4.9%, a difference of 0.080%), Immigrants from Canada (4.9%, a difference of 0.090%), Immigrants from Nepal (4.9%, a difference of 0.090%), Immigrants from Lithuania (4.9%, a difference of 0.12%), and Immigrants from Belgium (4.9%, a difference of 0.20%).
| Demographics | Rating | Rank | Female Unemployment |
| Slavs | 99.1 /100 | #52 | Exceptional 4.9% |
| Whites/Caucasians | 99.0 /100 | #53 | Exceptional 4.9% |
| Immigrants | Zimbabwe | 99.0 /100 | #54 | Exceptional 4.9% |
| Immigrants | Moldova | 99.0 /100 | #55 | Exceptional 4.9% |
| Serbians | 99.0 /100 | #56 | Exceptional 4.9% |
| Icelanders | 98.8 /100 | #57 | Exceptional 4.9% |
| Immigrants | Lithuania | 98.8 /100 | #58 | Exceptional 4.9% |
| Bhutanese | 98.7 /100 | #59 | Exceptional 4.9% |
| Immigrants | Scotland | 98.6 /100 | #60 | Exceptional 4.9% |
| Immigrants | Canada | 98.6 /100 | #61 | Exceptional 4.9% |
| Immigrants | Nepal | 98.6 /100 | #62 | Exceptional 4.9% |
| Immigrants | Belgium | 98.5 /100 | #63 | Exceptional 4.9% |
| Celtics | 98.5 /100 | #64 | Exceptional 4.9% |
| Immigrants | North America | 98.3 /100 | #65 | Exceptional 4.9% |
| Hungarians | 98.3 /100 | #66 | Exceptional 4.9% |
Demographics Similar to Koreans by Female Unemployment
In terms of female unemployment, the demographic groups most similar to Koreans are Immigrants from Costa Rica (5.4%, a difference of 0.040%), Choctaw (5.4%, a difference of 0.15%), Creek (5.4%, a difference of 0.24%), Ottawa (5.4%, a difference of 0.24%), and Uruguayan (5.4%, a difference of 0.26%).
| Demographics | Rating | Rank | Female Unemployment |
| Iroquois | 20.8 /100 | #202 | Fair 5.4% |
| Immigrants | South Eastern Asia | 20.3 /100 | #203 | Fair 5.4% |
| Immigrants | Israel | 19.7 /100 | #204 | Poor 5.4% |
| Immigrants | Afghanistan | 18.9 /100 | #205 | Poor 5.4% |
| Immigrants | Brazil | 18.8 /100 | #206 | Poor 5.4% |
| Creek | 15.4 /100 | #207 | Poor 5.4% |
| Immigrants | Costa Rica | 13.7 /100 | #208 | Poor 5.4% |
| Koreans | 13.4 /100 | #209 | Poor 5.4% |
| Choctaw | 12.3 /100 | #210 | Poor 5.4% |
| Ottawa | 11.6 /100 | #211 | Poor 5.4% |
| Uruguayans | 11.4 /100 | #212 | Poor 5.4% |
| Samoans | 10.6 /100 | #213 | Poor 5.4% |
| Seminole | 10.3 /100 | #214 | Poor 5.4% |
| Immigrants | Nicaragua | 10.2 /100 | #215 | Poor 5.4% |
| Comanche | 10.0 /100 | #216 | Poor 5.4% |