Immigrants from Dominican Republic vs Immigrants from the Azores Male Unemployment
COMPARE
Immigrants from Dominican Republic
Immigrants from the Azores
Male Unemployment
Male Unemployment Comparison
Immigrants from Dominican Republic
Immigrants from the Azores
7.6%
MALE UNEMPLOYMENT
0.0/ 100
METRIC RATING
326th/ 347
METRIC RANK
6.4%
MALE UNEMPLOYMENT
0.0/ 100
METRIC RATING
291st/ 347
METRIC RANK
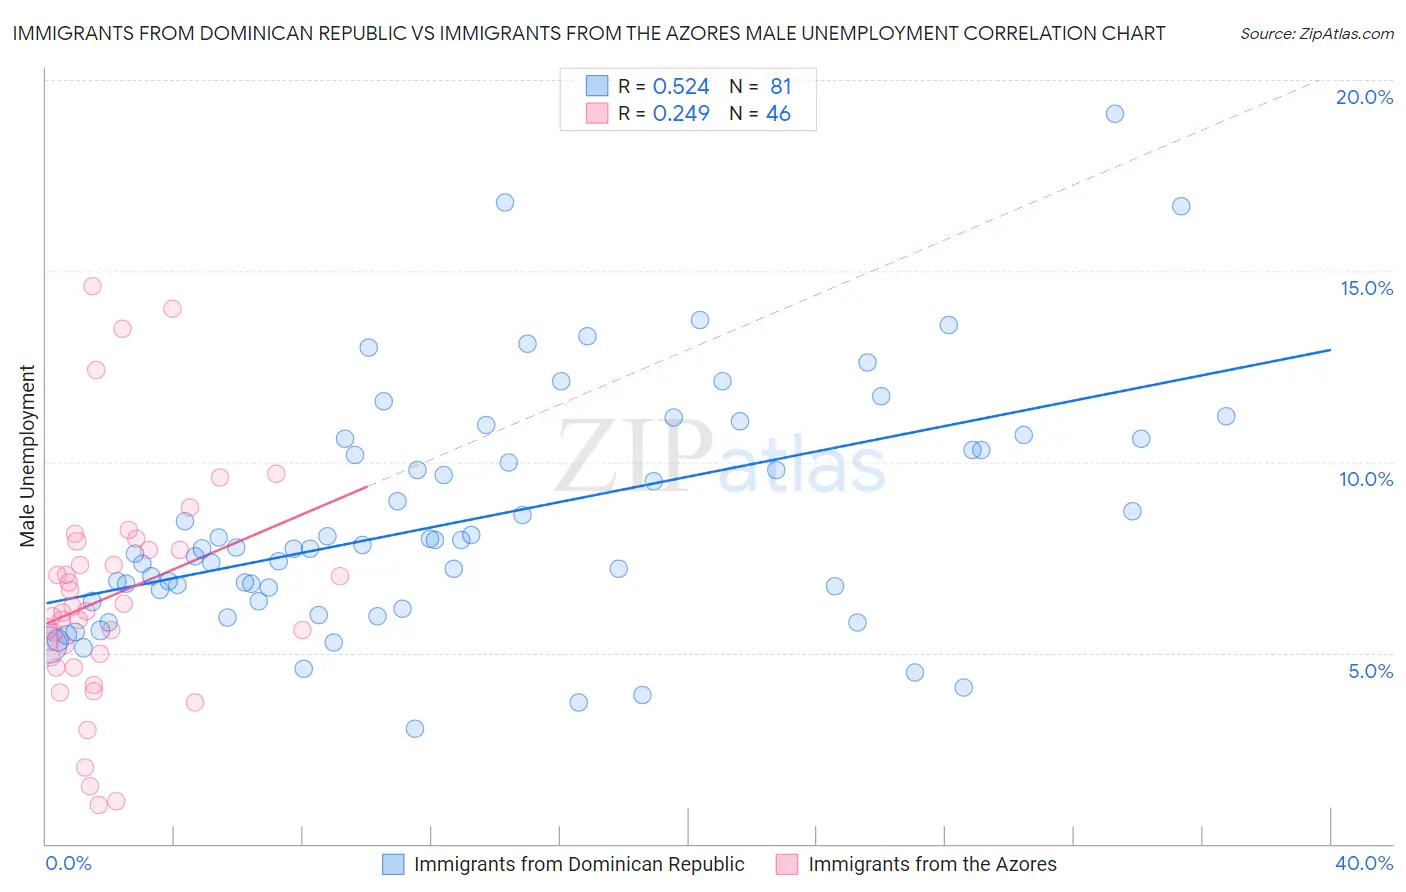
Immigrants from Dominican Republic vs Immigrants from the Azores Male Unemployment Correlation Chart
The statistical analysis conducted on geographies consisting of 274,236,953 people shows a substantial positive correlation between the proportion of Immigrants from Dominican Republic and unemployment rate among males in the United States with a correlation coefficient (R) of 0.524 and weighted average of 7.6%. Similarly, the statistical analysis conducted on geographies consisting of 46,221,475 people shows a weak positive correlation between the proportion of Immigrants from the Azores and unemployment rate among males in the United States with a correlation coefficient (R) of 0.249 and weighted average of 6.4%, a difference of 18.6%.
Male Unemployment Correlation Summary
| Measurement | Immigrants from Dominican Republic | Immigrants from the Azores |
| Minimum | 3.0% | 1.0% |
| Maximum | 19.1% | 14.6% |
| Range | 16.1% | 13.6% |
| Mean | 8.5% | 6.5% |
| Median | 7.7% | 6.1% |
| Interquartile 25% (IQ1) | 6.3% | 4.9% |
| Interquartile 75% (IQ3) | 10.5% | 7.7% |
| Interquartile Range (IQR) | 4.1% | 2.8% |
| Standard Deviation (Sample) | 3.1% | 3.0% |
| Standard Deviation (Population) | 3.1% | 3.0% |
Similar Demographics by Male Unemployment
Demographics Similar to Immigrants from Dominican Republic by Male Unemployment
In terms of male unemployment, the demographic groups most similar to Immigrants from Dominican Republic are Shoshone (7.6%, a difference of 0.10%), Dominican (7.6%, a difference of 0.48%), Immigrants from Grenada (7.6%, a difference of 0.75%), Paiute (7.7%, a difference of 1.1%), and Native/Alaskan (7.7%, a difference of 1.5%).
| Demographics | Rating | Rank | Male Unemployment |
| British West Indians | 0.0 /100 | #319 | Tragic 7.3% |
| Colville | 0.0 /100 | #320 | Tragic 7.4% |
| Immigrants | St. Vincent and the Grenadines | 0.0 /100 | #321 | Tragic 7.5% |
| Immigrants | Cabo Verde | 0.0 /100 | #322 | Tragic 7.5% |
| Immigrants | Grenada | 0.0 /100 | #323 | Tragic 7.6% |
| Dominicans | 0.0 /100 | #324 | Tragic 7.6% |
| Shoshone | 0.0 /100 | #325 | Tragic 7.6% |
| Immigrants | Dominican Republic | 0.0 /100 | #326 | Tragic 7.6% |
| Paiute | 0.0 /100 | #327 | Tragic 7.7% |
| Natives/Alaskans | 0.0 /100 | #328 | Tragic 7.7% |
| Immigrants | Yemen | 0.0 /100 | #329 | Tragic 7.8% |
| Yakama | 0.0 /100 | #330 | Tragic 7.9% |
| Alaska Natives | 0.0 /100 | #331 | Tragic 8.1% |
| Pima | 0.0 /100 | #332 | Tragic 8.3% |
| Sioux | 0.0 /100 | #333 | Tragic 8.4% |
Demographics Similar to Immigrants from the Azores by Male Unemployment
In terms of male unemployment, the demographic groups most similar to Immigrants from the Azores are Nepalese (6.4%, a difference of 0.34%), Haitian (6.4%, a difference of 0.38%), Senegalese (6.4%, a difference of 0.48%), U.S. Virgin Islander (6.4%, a difference of 0.52%), and Belizean (6.5%, a difference of 1.3%).
| Demographics | Rating | Rank | Male Unemployment |
| Spanish American Indians | 0.0 /100 | #284 | Tragic 6.2% |
| Immigrants | Ecuador | 0.0 /100 | #285 | Tragic 6.2% |
| Africans | 0.0 /100 | #286 | Tragic 6.3% |
| Central American Indians | 0.0 /100 | #287 | Tragic 6.3% |
| Immigrants | Senegal | 0.0 /100 | #288 | Tragic 6.3% |
| Immigrants | Caribbean | 0.0 /100 | #289 | Tragic 6.3% |
| U.S. Virgin Islanders | 0.0 /100 | #290 | Tragic 6.4% |
| Immigrants | Azores | 0.0 /100 | #291 | Tragic 6.4% |
| Nepalese | 0.0 /100 | #292 | Tragic 6.4% |
| Haitians | 0.0 /100 | #293 | Tragic 6.4% |
| Senegalese | 0.0 /100 | #294 | Tragic 6.4% |
| Belizeans | 0.0 /100 | #295 | Tragic 6.5% |
| Immigrants | Haiti | 0.0 /100 | #296 | Tragic 6.5% |
| Chippewa | 0.0 /100 | #297 | Tragic 6.6% |
| Jamaicans | 0.0 /100 | #298 | Tragic 6.6% |