Immigrants from North Macedonia vs Immigrants from Lithuania Unemployment Among Seniors over 65 years
COMPARE
Immigrants from North Macedonia
Immigrants from Lithuania
Unemployment Among Seniors over 65 years
Unemployment Among Seniors over 65 years Comparison
Immigrants from North Macedonia
Immigrants from Lithuania
4.8%
UNEMPLOYMENT AMONG SENIORS OVER 65 YEARS
100.0/ 100
METRIC RATING
29th/ 347
METRIC RANK
5.0%
UNEMPLOYMENT AMONG SENIORS OVER 65 YEARS
95.1/ 100
METRIC RATING
103rd/ 347
METRIC RANK
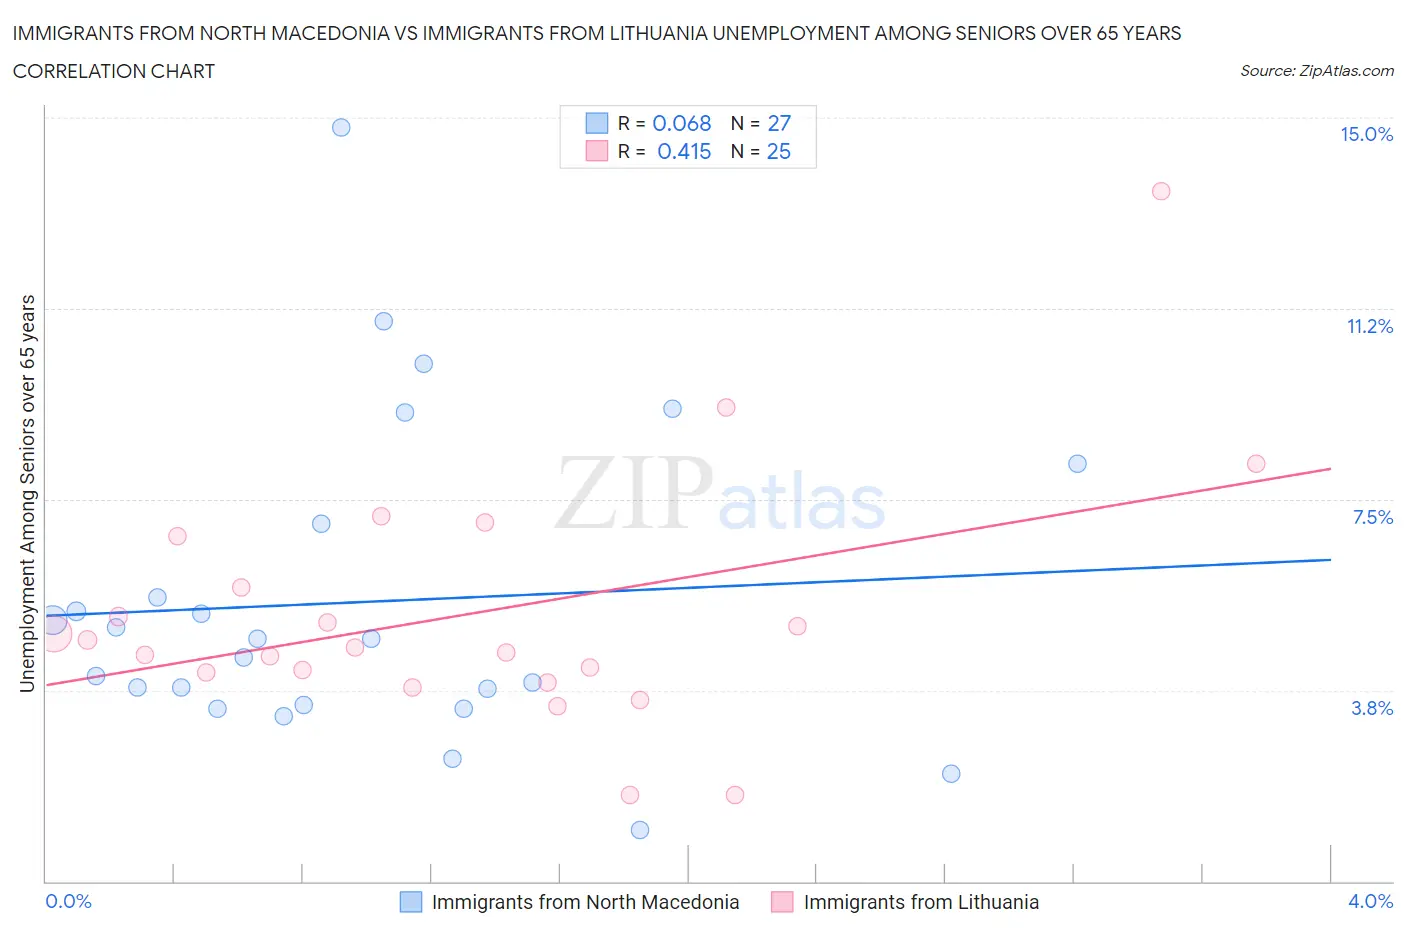
Immigrants from North Macedonia vs Immigrants from Lithuania Unemployment Among Seniors over 65 years Correlation Chart
The statistical analysis conducted on geographies consisting of 71,564,214 people shows a slight positive correlation between the proportion of Immigrants from North Macedonia and unemployment rate amomg seniors over the age of 65 in the United States with a correlation coefficient (R) of 0.068 and weighted average of 4.8%. Similarly, the statistical analysis conducted on geographies consisting of 113,554,800 people shows a moderate positive correlation between the proportion of Immigrants from Lithuania and unemployment rate amomg seniors over the age of 65 in the United States with a correlation coefficient (R) of 0.415 and weighted average of 5.0%, a difference of 5.2%.
Unemployment Among Seniors over 65 years Correlation Summary
| Measurement | Immigrants from North Macedonia | Immigrants from Lithuania |
| Minimum | 1.0% | 1.7% |
| Maximum | 14.8% | 13.6% |
| Range | 13.8% | 11.9% |
| Mean | 5.5% | 5.2% |
| Median | 4.8% | 4.6% |
| Interquartile 25% (IQ1) | 3.5% | 4.0% |
| Interquartile 75% (IQ3) | 7.0% | 6.3% |
| Interquartile Range (IQR) | 3.6% | 2.3% |
| Standard Deviation (Sample) | 3.1% | 2.5% |
| Standard Deviation (Population) | 3.1% | 2.4% |
Similar Demographics by Unemployment Among Seniors over 65 years
Demographics Similar to Immigrants from North Macedonia by Unemployment Among Seniors over 65 years
In terms of unemployment among seniors over 65 years, the demographic groups most similar to Immigrants from North Macedonia are Ugandan (4.8%, a difference of 0.090%), Houma (4.8%, a difference of 0.17%), Immigrants from Lebanon (4.8%, a difference of 0.24%), Belgian (4.8%, a difference of 0.40%), and Immigrants from Uganda (4.8%, a difference of 0.60%).
| Demographics | Rating | Rank | Unemployment Among Seniors over 65 years |
| Czechs | 100.0 /100 | #22 | Exceptional 4.7% |
| Kenyans | 100.0 /100 | #23 | Exceptional 4.7% |
| Iraqis | 100.0 /100 | #24 | Exceptional 4.7% |
| Tongans | 100.0 /100 | #25 | Exceptional 4.7% |
| Immigrants | Lebanon | 100.0 /100 | #26 | Exceptional 4.8% |
| Houma | 100.0 /100 | #27 | Exceptional 4.8% |
| Ugandans | 100.0 /100 | #28 | Exceptional 4.8% |
| Immigrants | North Macedonia | 100.0 /100 | #29 | Exceptional 4.8% |
| Belgians | 100.0 /100 | #30 | Exceptional 4.8% |
| Immigrants | Uganda | 100.0 /100 | #31 | Exceptional 4.8% |
| Slovenes | 100.0 /100 | #32 | Exceptional 4.8% |
| Palestinians | 100.0 /100 | #33 | Exceptional 4.8% |
| Bhutanese | 100.0 /100 | #34 | Exceptional 4.8% |
| Immigrants | Kuwait | 100.0 /100 | #35 | Exceptional 4.8% |
| Cambodians | 100.0 /100 | #36 | Exceptional 4.8% |
Demographics Similar to Immigrants from Lithuania by Unemployment Among Seniors over 65 years
In terms of unemployment among seniors over 65 years, the demographic groups most similar to Immigrants from Lithuania are Immigrants from Scotland (5.0%, a difference of 0.020%), Immigrants from Thailand (5.0%, a difference of 0.050%), Yugoslavian (5.0%, a difference of 0.060%), Okinawan (5.0%, a difference of 0.070%), and Romanian (5.0%, a difference of 0.080%).
| Demographics | Rating | Rank | Unemployment Among Seniors over 65 years |
| Immigrants | Singapore | 96.8 /100 | #96 | Exceptional 5.0% |
| Immigrants | Oceania | 96.8 /100 | #97 | Exceptional 5.0% |
| Czechoslovakians | 96.7 /100 | #98 | Exceptional 5.0% |
| South Africans | 96.5 /100 | #99 | Exceptional 5.0% |
| Romanians | 95.5 /100 | #100 | Exceptional 5.0% |
| Yugoslavians | 95.4 /100 | #101 | Exceptional 5.0% |
| Immigrants | Thailand | 95.4 /100 | #102 | Exceptional 5.0% |
| Immigrants | Lithuania | 95.1 /100 | #103 | Exceptional 5.0% |
| Immigrants | Scotland | 95.0 /100 | #104 | Exceptional 5.0% |
| Okinawans | 94.7 /100 | #105 | Exceptional 5.0% |
| Immigrants | Turkey | 94.3 /100 | #106 | Exceptional 5.0% |
| Immigrants | Germany | 93.2 /100 | #107 | Exceptional 5.0% |
| Immigrants | Vietnam | 92.9 /100 | #108 | Exceptional 5.0% |
| Immigrants | Malaysia | 92.7 /100 | #109 | Exceptional 5.0% |
| Immigrants | Saudi Arabia | 92.7 /100 | #110 | Exceptional 5.0% |