Belizean vs Immigrants from Venezuela Unemployment Among Seniors over 65 years
COMPARE
Belizean
Immigrants from Venezuela
Unemployment Among Seniors over 65 years
Unemployment Among Seniors over 65 years Comparison
Belizeans
Immigrants from Venezuela
5.5%
UNEMPLOYMENT AMONG SENIORS OVER 65 YEARS
0.0/ 100
METRIC RATING
292nd/ 347
METRIC RANK
5.5%
UNEMPLOYMENT AMONG SENIORS OVER 65 YEARS
0.0/ 100
METRIC RATING
293rd/ 347
METRIC RANK
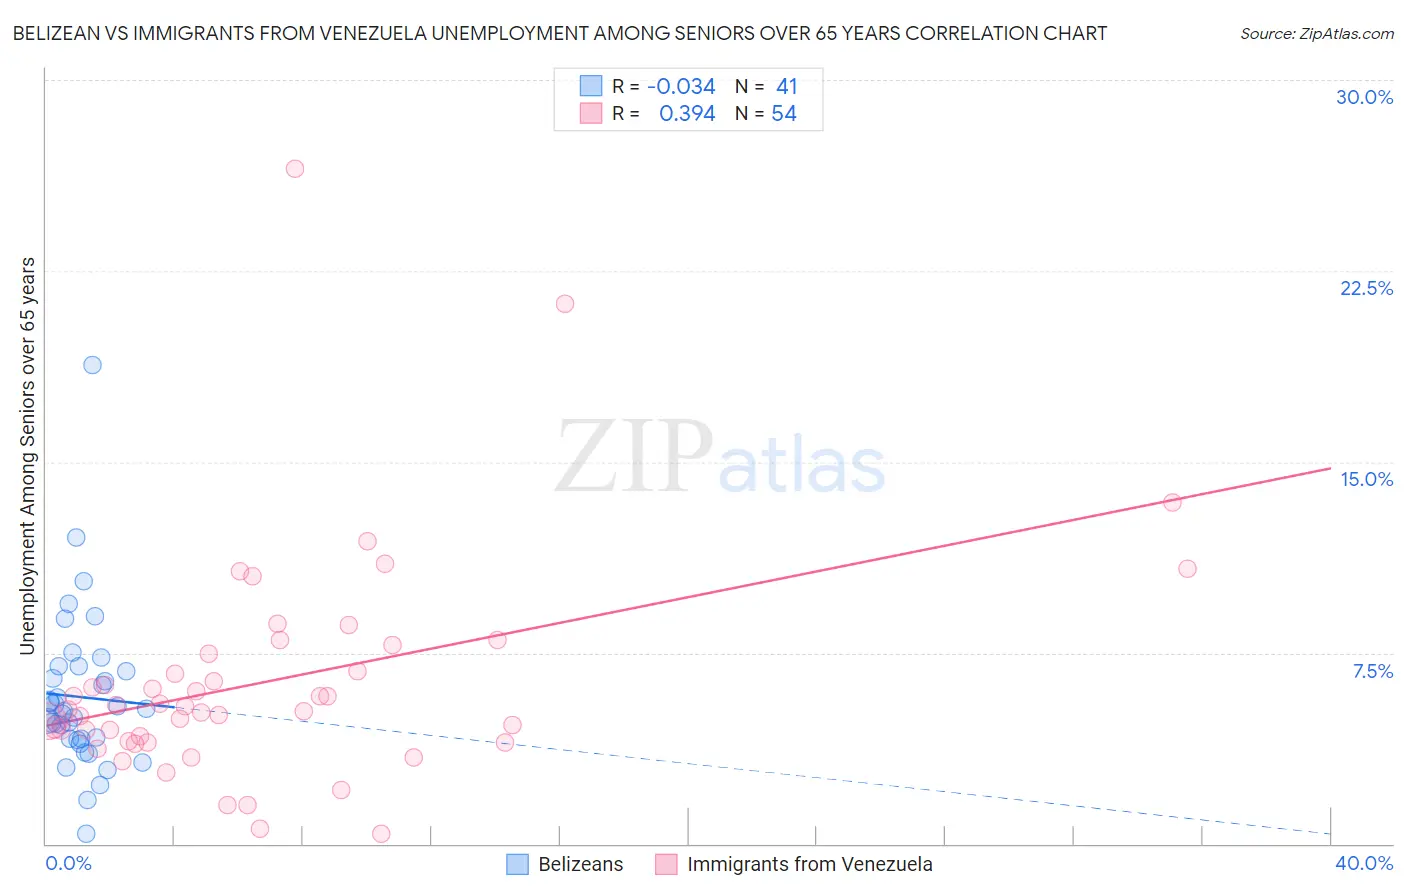
Belizean vs Immigrants from Venezuela Unemployment Among Seniors over 65 years Correlation Chart
The statistical analysis conducted on geographies consisting of 139,335,808 people shows no correlation between the proportion of Belizeans and unemployment rate amomg seniors over the age of 65 in the United States with a correlation coefficient (R) of -0.034 and weighted average of 5.5%. Similarly, the statistical analysis conducted on geographies consisting of 268,216,746 people shows a mild positive correlation between the proportion of Immigrants from Venezuela and unemployment rate amomg seniors over the age of 65 in the United States with a correlation coefficient (R) of 0.394 and weighted average of 5.5%, a difference of 0.040%.
Unemployment Among Seniors over 65 years Correlation Summary
| Measurement | Belizean | Immigrants from Venezuela |
| Minimum | 0.41% | 0.40% |
| Maximum | 18.8% | 26.5% |
| Range | 18.4% | 26.1% |
| Mean | 5.8% | 6.4% |
| Median | 5.2% | 5.3% |
| Interquartile 25% (IQ1) | 4.1% | 4.0% |
| Interquartile 75% (IQ3) | 6.9% | 7.5% |
| Interquartile Range (IQR) | 2.8% | 3.4% |
| Standard Deviation (Sample) | 3.1% | 4.4% |
| Standard Deviation (Population) | 3.1% | 4.4% |
Demographics Similar to Belizeans and Immigrants from Venezuela by Unemployment Among Seniors over 65 years
In terms of unemployment among seniors over 65 years, the demographic groups most similar to Belizeans are Armenian (5.5%, a difference of 0.080%), Black/African American (5.5%, a difference of 0.15%), Cheyenne (5.5%, a difference of 0.15%), Cape Verdean (5.5%, a difference of 0.15%), and Yaqui (5.5%, a difference of 0.16%). Similarly, the demographic groups most similar to Immigrants from Venezuela are Armenian (5.5%, a difference of 0.040%), Cheyenne (5.5%, a difference of 0.11%), Cape Verdean (5.5%, a difference of 0.11%), Yaqui (5.5%, a difference of 0.12%), and Black/African American (5.5%, a difference of 0.19%).
| Demographics | Rating | Rank | Unemployment Among Seniors over 65 years |
| Immigrants | Belize | 0.0 /100 | #282 | Tragic 5.5% |
| Immigrants | Haiti | 0.0 /100 | #283 | Tragic 5.5% |
| Immigrants | Liberia | 0.0 /100 | #284 | Tragic 5.5% |
| Central Americans | 0.0 /100 | #285 | Tragic 5.5% |
| Immigrants | Barbados | 0.0 /100 | #286 | Tragic 5.5% |
| Venezuelans | 0.0 /100 | #287 | Tragic 5.5% |
| U.S. Virgin Islanders | 0.0 /100 | #288 | Tragic 5.5% |
| Immigrants | Cabo Verde | 0.0 /100 | #289 | Tragic 5.5% |
| Jamaicans | 0.0 /100 | #290 | Tragic 5.5% |
| Blacks/African Americans | 0.0 /100 | #291 | Tragic 5.5% |
| Belizeans | 0.0 /100 | #292 | Tragic 5.5% |
| Immigrants | Venezuela | 0.0 /100 | #293 | Tragic 5.5% |
| Armenians | 0.0 /100 | #294 | Tragic 5.5% |
| Cheyenne | 0.0 /100 | #295 | Tragic 5.5% |
| Cape Verdeans | 0.0 /100 | #296 | Tragic 5.5% |
| Yaqui | 0.0 /100 | #297 | Tragic 5.5% |
| Immigrants | West Indies | 0.0 /100 | #298 | Tragic 5.6% |
| Guyanese | 0.0 /100 | #299 | Tragic 5.6% |
| Zimbabweans | 0.0 /100 | #300 | Tragic 5.6% |
| Hispanics or Latinos | 0.0 /100 | #301 | Tragic 5.6% |
| Guatemalans | 0.0 /100 | #302 | Tragic 5.6% |