Belgian vs Immigrants from Ethiopia Male Disability
COMPARE
Belgian
Immigrants from Ethiopia
Male Disability
Male Disability Comparison
Belgians
Immigrants from Ethiopia
12.1%
MALE DISABILITY
0.3/ 100
METRIC RATING
259th/ 347
METRIC RANK
10.2%
MALE DISABILITY
99.9/ 100
METRIC RATING
33rd/ 347
METRIC RANK
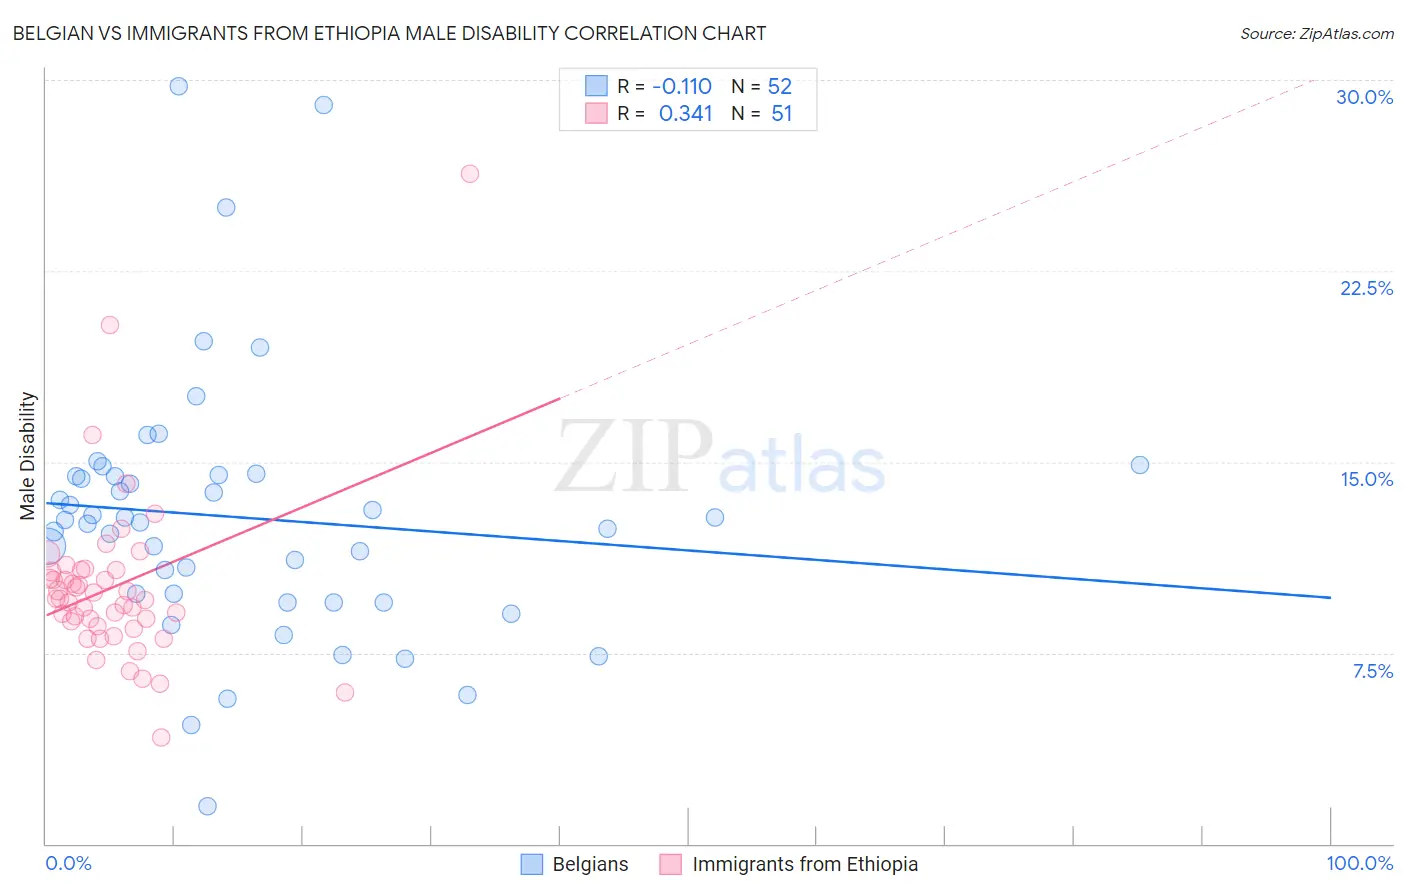
Belgian vs Immigrants from Ethiopia Male Disability Correlation Chart
The statistical analysis conducted on geographies consisting of 355,990,096 people shows a poor negative correlation between the proportion of Belgians and percentage of males with a disability in the United States with a correlation coefficient (R) of -0.110 and weighted average of 12.1%. Similarly, the statistical analysis conducted on geographies consisting of 211,544,551 people shows a mild positive correlation between the proportion of Immigrants from Ethiopia and percentage of males with a disability in the United States with a correlation coefficient (R) of 0.341 and weighted average of 10.2%, a difference of 19.0%.
Male Disability Correlation Summary
| Measurement | Belgian | Immigrants from Ethiopia |
| Minimum | 1.4% | 4.2% |
| Maximum | 29.8% | 26.3% |
| Range | 28.3% | 22.2% |
| Mean | 12.8% | 10.1% |
| Median | 12.7% | 9.6% |
| Interquartile 25% (IQ1) | 9.7% | 8.6% |
| Interquartile 75% (IQ3) | 14.5% | 10.8% |
| Interquartile Range (IQR) | 4.8% | 2.2% |
| Standard Deviation (Sample) | 5.2% | 3.4% |
| Standard Deviation (Population) | 5.1% | 3.4% |
Similar Demographics by Male Disability
Demographics Similar to Belgians by Male Disability
In terms of male disability, the demographic groups most similar to Belgians are Basque (12.1%, a difference of 0.040%), Swedish (12.1%, a difference of 0.070%), Swiss (12.1%, a difference of 0.24%), European (12.1%, a difference of 0.24%), and Slavic (12.2%, a difference of 0.43%).
| Demographics | Rating | Rank | Male Disability |
| Slovenes | 0.5 /100 | #252 | Tragic 12.0% |
| Guamanians/Chamorros | 0.5 /100 | #253 | Tragic 12.0% |
| British | 0.4 /100 | #254 | Tragic 12.1% |
| Chinese | 0.4 /100 | #255 | Tragic 12.1% |
| Swiss | 0.3 /100 | #256 | Tragic 12.1% |
| Europeans | 0.3 /100 | #257 | Tragic 12.1% |
| Basques | 0.3 /100 | #258 | Tragic 12.1% |
| Belgians | 0.3 /100 | #259 | Tragic 12.1% |
| Swedes | 0.3 /100 | #260 | Tragic 12.1% |
| Slavs | 0.2 /100 | #261 | Tragic 12.2% |
| Norwegians | 0.2 /100 | #262 | Tragic 12.2% |
| Canadians | 0.2 /100 | #263 | Tragic 12.2% |
| Nepalese | 0.2 /100 | #264 | Tragic 12.2% |
| Immigrants | Portugal | 0.1 /100 | #265 | Tragic 12.3% |
| Hawaiians | 0.1 /100 | #266 | Tragic 12.3% |
Demographics Similar to Immigrants from Ethiopia by Male Disability
In terms of male disability, the demographic groups most similar to Immigrants from Ethiopia are Immigrants from Turkey (10.2%, a difference of 0.060%), Immigrants from Argentina (10.2%, a difference of 0.17%), Ethiopian (10.2%, a difference of 0.22%), Immigrants from Indonesia (10.2%, a difference of 0.30%), and Immigrants from Kuwait (10.2%, a difference of 0.47%).
| Demographics | Rating | Rank | Male Disability |
| Paraguayans | 99.9 /100 | #26 | Exceptional 10.1% |
| Egyptians | 99.9 /100 | #27 | Exceptional 10.1% |
| Vietnamese | 99.9 /100 | #28 | Exceptional 10.1% |
| Venezuelans | 99.9 /100 | #29 | Exceptional 10.1% |
| Immigrants | Egypt | 99.9 /100 | #30 | Exceptional 10.1% |
| Soviet Union | 99.9 /100 | #31 | Exceptional 10.1% |
| Argentineans | 99.9 /100 | #32 | Exceptional 10.1% |
| Immigrants | Ethiopia | 99.9 /100 | #33 | Exceptional 10.2% |
| Immigrants | Turkey | 99.9 /100 | #34 | Exceptional 10.2% |
| Immigrants | Argentina | 99.9 /100 | #35 | Exceptional 10.2% |
| Ethiopians | 99.8 /100 | #36 | Exceptional 10.2% |
| Immigrants | Indonesia | 99.8 /100 | #37 | Exceptional 10.2% |
| Immigrants | Kuwait | 99.8 /100 | #38 | Exceptional 10.2% |
| Afghans | 99.8 /100 | #39 | Exceptional 10.2% |
| Immigrants | Nepal | 99.8 /100 | #40 | Exceptional 10.3% |