German vs Puget Sound Salish Unemployment Among Youth under 25 years
COMPARE
German
Puget Sound Salish
Unemployment Among Youth under 25 years
Unemployment Among Youth under 25 years Comparison
Germans
Puget Sound Salish
10.5%
UNEMPLOYMENT AMONG YOUTH UNDER 25 YEARS
100.0/ 100
METRIC RATING
9th/ 347
METRIC RANK
12.5%
UNEMPLOYMENT AMONG YOUTH UNDER 25 YEARS
0.1/ 100
METRIC RATING
264th/ 347
METRIC RANK
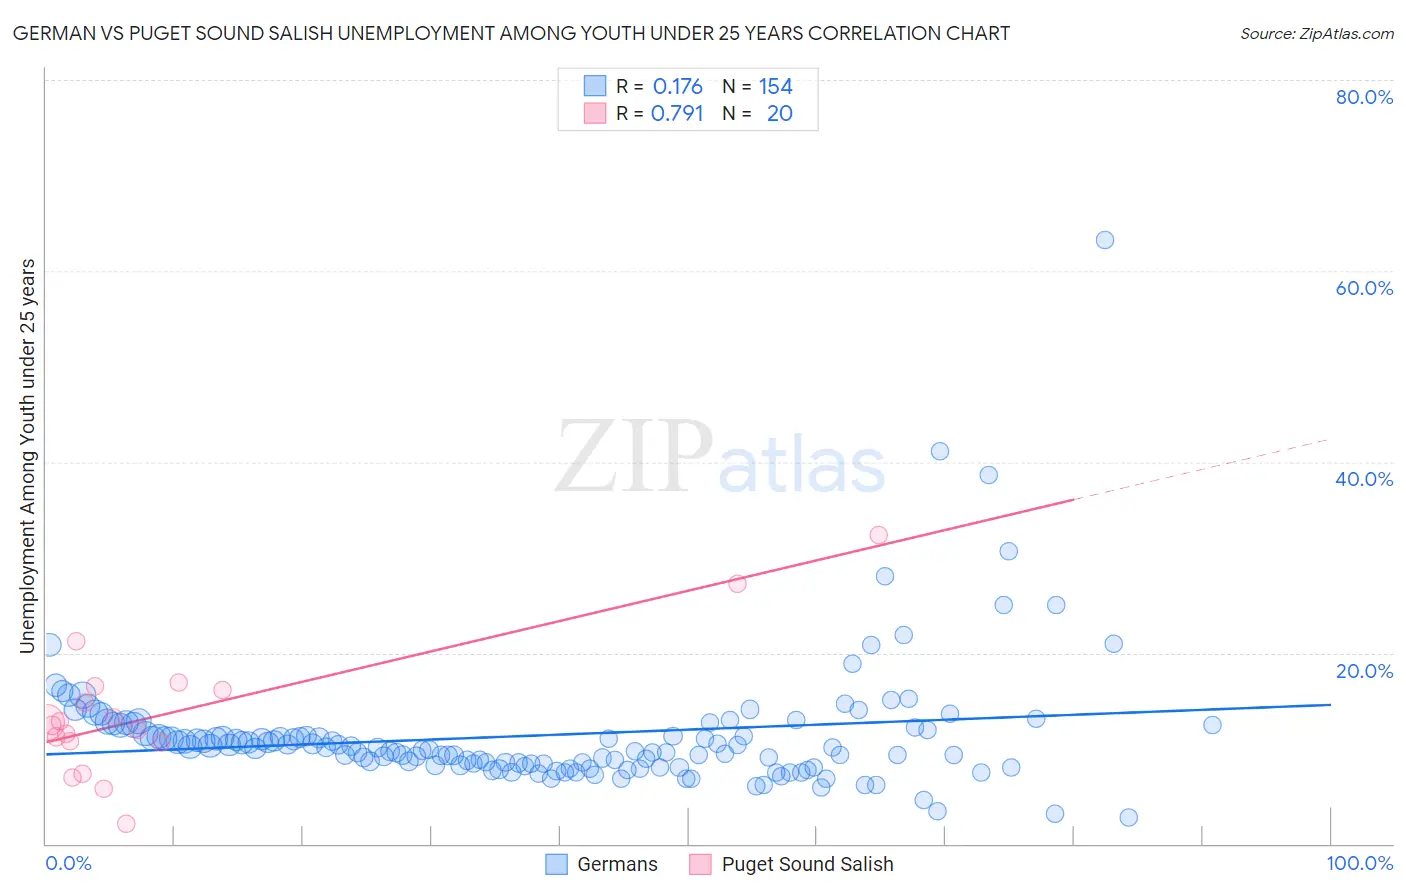
German vs Puget Sound Salish Unemployment Among Youth under 25 years Correlation Chart
The statistical analysis conducted on geographies consisting of 552,720,168 people shows a poor positive correlation between the proportion of Germans and unemployment rate among youth under the age of 25 in the United States with a correlation coefficient (R) of 0.176 and weighted average of 10.5%. Similarly, the statistical analysis conducted on geographies consisting of 45,930,945 people shows a strong positive correlation between the proportion of Puget Sound Salish and unemployment rate among youth under the age of 25 in the United States with a correlation coefficient (R) of 0.791 and weighted average of 12.5%, a difference of 18.9%.
Unemployment Among Youth under 25 years Correlation Summary
| Measurement | German | Puget Sound Salish |
| Minimum | 2.8% | 2.1% |
| Maximum | 63.2% | 32.3% |
| Range | 60.4% | 30.2% |
| Mean | 11.4% | 13.7% |
| Median | 10.1% | 12.6% |
| Interquartile 25% (IQ1) | 8.2% | 10.7% |
| Interquartile 75% (IQ3) | 11.9% | 16.3% |
| Interquartile Range (IQR) | 3.6% | 5.6% |
| Standard Deviation (Sample) | 6.8% | 7.0% |
| Standard Deviation (Population) | 6.7% | 6.8% |
Similar Demographics by Unemployment Among Youth under 25 years
Demographics Similar to Germans by Unemployment Among Youth under 25 years
In terms of unemployment among youth under 25 years, the demographic groups most similar to Germans are Immigrants from Somalia (10.5%, a difference of 0.020%), Scandinavian (10.5%, a difference of 0.15%), Immigrants from Sudan (10.5%, a difference of 0.33%), Immigrants from Venezuela (10.5%, a difference of 0.40%), and Indonesian (10.6%, a difference of 0.45%).
| Demographics | Rating | Rank | Unemployment Among Youth under 25 years |
| Immigrants | Cuba | 100.0 /100 | #2 | Exceptional 10.0% |
| Luxembourgers | 100.0 /100 | #3 | Exceptional 10.0% |
| Zimbabweans | 100.0 /100 | #4 | Exceptional 10.2% |
| Czechs | 100.0 /100 | #5 | Exceptional 10.3% |
| Danes | 100.0 /100 | #6 | Exceptional 10.3% |
| Swedes | 100.0 /100 | #7 | Exceptional 10.4% |
| Immigrants | Venezuela | 100.0 /100 | #8 | Exceptional 10.5% |
| Germans | 100.0 /100 | #9 | Exceptional 10.5% |
| Immigrants | Somalia | 100.0 /100 | #10 | Exceptional 10.5% |
| Scandinavians | 100.0 /100 | #11 | Exceptional 10.5% |
| Immigrants | Sudan | 100.0 /100 | #12 | Exceptional 10.5% |
| Indonesians | 100.0 /100 | #13 | Exceptional 10.6% |
| Cubans | 100.0 /100 | #14 | Exceptional 10.6% |
| Sudanese | 100.0 /100 | #15 | Exceptional 10.6% |
| Venezuelans | 100.0 /100 | #16 | Exceptional 10.6% |
Demographics Similar to Puget Sound Salish by Unemployment Among Youth under 25 years
In terms of unemployment among youth under 25 years, the demographic groups most similar to Puget Sound Salish are Nepalese (12.5%, a difference of 0.10%), Cree (12.4%, a difference of 0.47%), Immigrants from Mexico (12.4%, a difference of 0.56%), Immigrants from El Salvador (12.4%, a difference of 0.61%), and Immigrants from Panama (12.4%, a difference of 0.63%).
| Demographics | Rating | Rank | Unemployment Among Youth under 25 years |
| Panamanians | 0.2 /100 | #257 | Tragic 12.4% |
| Salvadorans | 0.1 /100 | #258 | Tragic 12.4% |
| Immigrants | Central America | 0.1 /100 | #259 | Tragic 12.4% |
| Immigrants | Panama | 0.1 /100 | #260 | Tragic 12.4% |
| Immigrants | El Salvador | 0.1 /100 | #261 | Tragic 12.4% |
| Immigrants | Mexico | 0.1 /100 | #262 | Tragic 12.4% |
| Cree | 0.1 /100 | #263 | Tragic 12.4% |
| Puget Sound Salish | 0.1 /100 | #264 | Tragic 12.5% |
| Nepalese | 0.0 /100 | #265 | Tragic 12.5% |
| Immigrants | Latin America | 0.0 /100 | #266 | Tragic 12.6% |
| Sub-Saharan Africans | 0.0 /100 | #267 | Tragic 12.6% |
| Tlingit-Haida | 0.0 /100 | #268 | Tragic 12.7% |
| Kiowa | 0.0 /100 | #269 | Tragic 12.7% |
| Immigrants | Liberia | 0.0 /100 | #270 | Tragic 12.8% |
| Immigrants | Bahamas | 0.0 /100 | #271 | Tragic 12.9% |