Barbadian vs Aleut Unemployment Among Youth under 25 years
COMPARE
Barbadian
Aleut
Unemployment Among Youth under 25 years
Unemployment Among Youth under 25 years Comparison
Barbadians
Aleuts
14.6%
UNEMPLOYMENT AMONG YOUTH UNDER 25 YEARS
0.0/ 100
METRIC RATING
320th/ 347
METRIC RANK
14.1%
UNEMPLOYMENT AMONG YOUTH UNDER 25 YEARS
0.0/ 100
METRIC RATING
309th/ 347
METRIC RANK
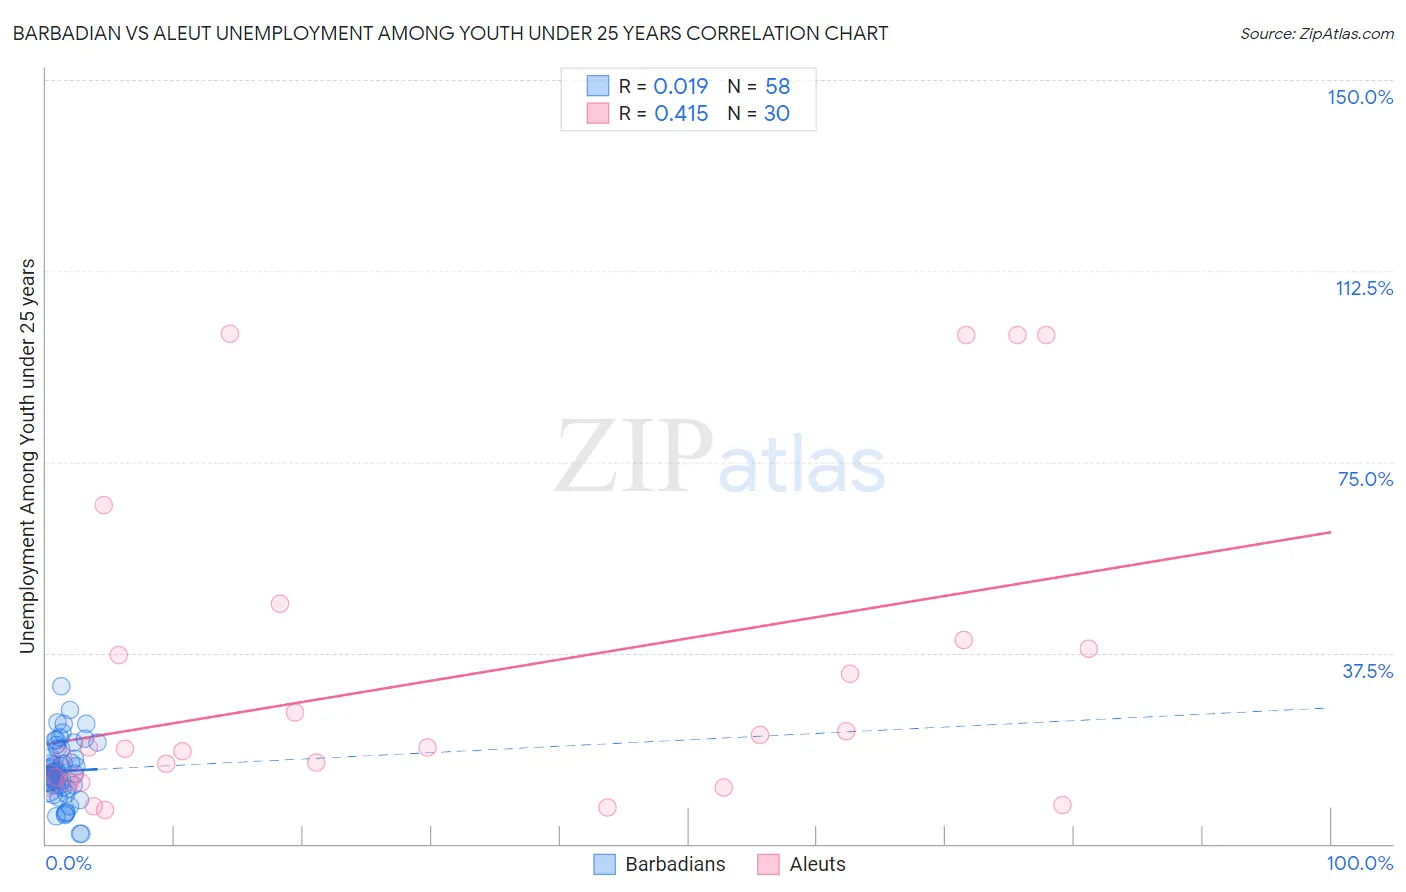
Barbadian vs Aleut Unemployment Among Youth under 25 years Correlation Chart
The statistical analysis conducted on geographies consisting of 140,921,379 people shows no correlation between the proportion of Barbadians and unemployment rate among youth under the age of 25 in the United States with a correlation coefficient (R) of 0.019 and weighted average of 14.6%. Similarly, the statistical analysis conducted on geographies consisting of 61,559,478 people shows a moderate positive correlation between the proportion of Aleuts and unemployment rate among youth under the age of 25 in the United States with a correlation coefficient (R) of 0.415 and weighted average of 14.1%, a difference of 3.3%.
Unemployment Among Youth under 25 years Correlation Summary
| Measurement | Barbadian | Aleut |
| Minimum | 2.0% | 6.6% |
| Maximum | 31.0% | 100.1% |
| Range | 29.0% | 93.5% |
| Mean | 14.3% | 31.9% |
| Median | 13.6% | 18.8% |
| Interquartile 25% (IQ1) | 11.5% | 12.4% |
| Interquartile 75% (IQ3) | 18.6% | 38.4% |
| Interquartile Range (IQR) | 7.1% | 26.0% |
| Standard Deviation (Sample) | 5.8% | 30.3% |
| Standard Deviation (Population) | 5.8% | 29.8% |
Demographics Similar to Barbadians and Aleuts by Unemployment Among Youth under 25 years
In terms of unemployment among youth under 25 years, the demographic groups most similar to Barbadians are West Indian (14.6%, a difference of 0.040%), Immigrants from Dominica (14.6%, a difference of 0.080%), Cheyenne (14.6%, a difference of 0.16%), Trinidadian and Tobagonian (14.6%, a difference of 0.23%), and Immigrants from Trinidad and Tobago (14.6%, a difference of 0.32%). Similarly, the demographic groups most similar to Aleuts are Immigrants from West Indies (14.2%, a difference of 0.54%), Immigrants from Bangladesh (14.2%, a difference of 0.57%), Immigrants from Belize (14.0%, a difference of 0.86%), Vietnamese (14.3%, a difference of 0.89%), and Immigrants from Haiti (14.0%, a difference of 1.3%).
| Demographics | Rating | Rank | Unemployment Among Youth under 25 years |
| Houma | 0.0 /100 | #304 | Tragic 13.8% |
| Haitians | 0.0 /100 | #305 | Tragic 13.9% |
| Pueblo | 0.0 /100 | #306 | Tragic 13.9% |
| Immigrants | Haiti | 0.0 /100 | #307 | Tragic 14.0% |
| Immigrants | Belize | 0.0 /100 | #308 | Tragic 14.0% |
| Aleuts | 0.0 /100 | #309 | Tragic 14.1% |
| Immigrants | West Indies | 0.0 /100 | #310 | Tragic 14.2% |
| Immigrants | Bangladesh | 0.0 /100 | #311 | Tragic 14.2% |
| Vietnamese | 0.0 /100 | #312 | Tragic 14.3% |
| Immigrants | Armenia | 0.0 /100 | #313 | Tragic 14.4% |
| Jamaicans | 0.0 /100 | #314 | Tragic 14.4% |
| Sioux | 0.0 /100 | #315 | Tragic 14.4% |
| Natives/Alaskans | 0.0 /100 | #316 | Tragic 14.5% |
| Blacks/African Americans | 0.0 /100 | #317 | Tragic 14.5% |
| Immigrants | Dominica | 0.0 /100 | #318 | Tragic 14.6% |
| West Indians | 0.0 /100 | #319 | Tragic 14.6% |
| Barbadians | 0.0 /100 | #320 | Tragic 14.6% |
| Cheyenne | 0.0 /100 | #321 | Tragic 14.6% |
| Trinidadians and Tobagonians | 0.0 /100 | #322 | Tragic 14.6% |
| Immigrants | Trinidad and Tobago | 0.0 /100 | #323 | Tragic 14.6% |
| Immigrants | Jamaica | 0.0 /100 | #324 | Tragic 14.8% |