Barbadian vs Dutch Unemployment Among Ages 20 to 24 years
COMPARE
Barbadian
Dutch
Unemployment Among Ages 20 to 24 years
Unemployment Among Ages 20 to 24 years Comparison
Barbadians
Dutch
12.9%
UNEMPLOYMENT AMONG AGES 20 TO 24 YEARS
0.0/ 100
METRIC RATING
318th/ 347
METRIC RANK
9.6%
UNEMPLOYMENT AMONG AGES 20 TO 24 YEARS
99.9/ 100
METRIC RATING
39th/ 347
METRIC RANK
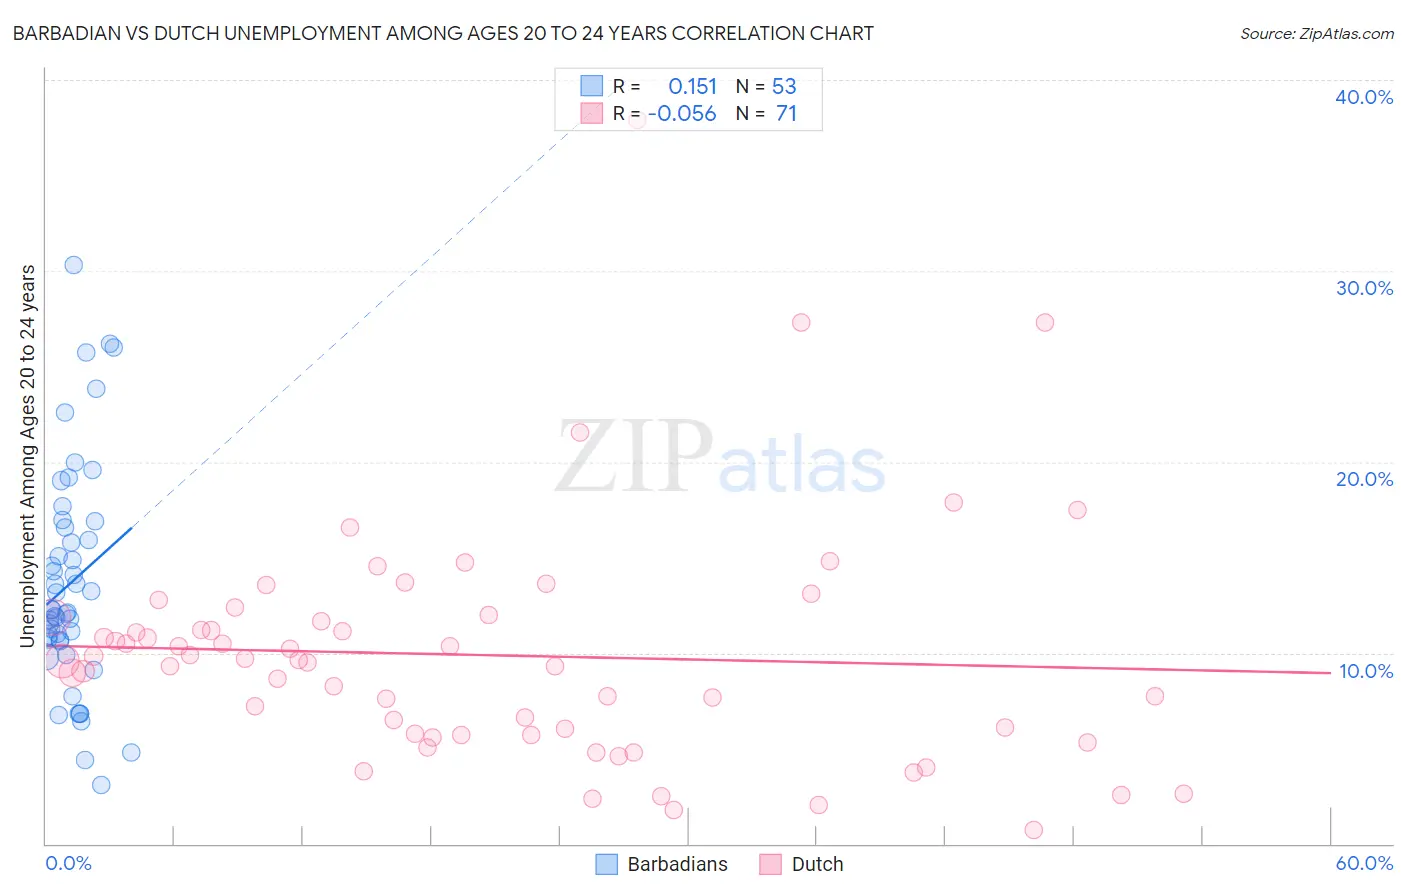
Barbadian vs Dutch Unemployment Among Ages 20 to 24 years Correlation Chart
The statistical analysis conducted on geographies consisting of 140,027,107 people shows a poor positive correlation between the proportion of Barbadians and unemployment rate among population between the ages 20 and 24 in the United States with a correlation coefficient (R) of 0.151 and weighted average of 12.9%. Similarly, the statistical analysis conducted on geographies consisting of 510,210,061 people shows a slight negative correlation between the proportion of Dutch and unemployment rate among population between the ages 20 and 24 in the United States with a correlation coefficient (R) of -0.056 and weighted average of 9.6%, a difference of 33.8%.
Unemployment Among Ages 20 to 24 years Correlation Summary
| Measurement | Barbadian | Dutch |
| Minimum | 3.1% | 0.70% |
| Maximum | 30.3% | 37.9% |
| Range | 27.2% | 37.2% |
| Mean | 13.7% | 9.9% |
| Median | 12.2% | 9.6% |
| Interquartile 25% (IQ1) | 10.6% | 5.7% |
| Interquartile 75% (IQ3) | 16.7% | 11.9% |
| Interquartile Range (IQR) | 6.1% | 6.2% |
| Standard Deviation (Sample) | 5.9% | 6.2% |
| Standard Deviation (Population) | 5.8% | 6.1% |
Similar Demographics by Unemployment Among Ages 20 to 24 years
Demographics Similar to Barbadians by Unemployment Among Ages 20 to 24 years
In terms of unemployment among ages 20 to 24 years, the demographic groups most similar to Barbadians are Immigrants from Trinidad and Tobago (12.8%, a difference of 0.25%), Trinidadian and Tobagonian (12.9%, a difference of 0.25%), Immigrants from Dominica (12.8%, a difference of 0.37%), Cheyenne (13.0%, a difference of 0.68%), and Immigrants from Jamaica (13.0%, a difference of 0.76%).
| Demographics | Rating | Rank | Unemployment Among Ages 20 to 24 years |
| Vietnamese | 0.0 /100 | #311 | Tragic 12.6% |
| Houma | 0.0 /100 | #312 | Tragic 12.6% |
| Shoshone | 0.0 /100 | #313 | Tragic 12.7% |
| Blacks/African Americans | 0.0 /100 | #314 | Tragic 12.7% |
| West Indians | 0.0 /100 | #315 | Tragic 12.8% |
| Immigrants | Dominica | 0.0 /100 | #316 | Tragic 12.8% |
| Immigrants | Trinidad and Tobago | 0.0 /100 | #317 | Tragic 12.8% |
| Barbadians | 0.0 /100 | #318 | Tragic 12.9% |
| Trinidadians and Tobagonians | 0.0 /100 | #319 | Tragic 12.9% |
| Cheyenne | 0.0 /100 | #320 | Tragic 13.0% |
| Immigrants | Jamaica | 0.0 /100 | #321 | Tragic 13.0% |
| Natives/Alaskans | 0.0 /100 | #322 | Tragic 13.0% |
| Yakama | 0.0 /100 | #323 | Tragic 13.1% |
| Alaska Natives | 0.0 /100 | #324 | Tragic 13.2% |
| Pueblo | 0.0 /100 | #325 | Tragic 13.2% |
Demographics Similar to Dutch by Unemployment Among Ages 20 to 24 years
In terms of unemployment among ages 20 to 24 years, the demographic groups most similar to Dutch are Immigrants from Ethiopia (9.6%, a difference of 0.040%), Afghan (9.6%, a difference of 0.22%), Immigrants from Zaire (9.6%, a difference of 0.29%), Belgian (9.6%, a difference of 0.37%), and German (9.6%, a difference of 0.40%).
| Demographics | Rating | Rank | Unemployment Among Ages 20 to 24 years |
| Cambodians | 100.0 /100 | #32 | Exceptional 9.5% |
| Australians | 100.0 /100 | #33 | Exceptional 9.6% |
| Yugoslavians | 100.0 /100 | #34 | Exceptional 9.6% |
| Germans | 100.0 /100 | #35 | Exceptional 9.6% |
| Belgians | 100.0 /100 | #36 | Exceptional 9.6% |
| Immigrants | Zaire | 100.0 /100 | #37 | Exceptional 9.6% |
| Afghans | 99.9 /100 | #38 | Exceptional 9.6% |
| Dutch | 99.9 /100 | #39 | Exceptional 9.6% |
| Immigrants | Ethiopia | 99.9 /100 | #40 | Exceptional 9.6% |
| Swiss | 99.9 /100 | #41 | Exceptional 9.7% |
| Immigrants | Saudi Arabia | 99.9 /100 | #42 | Exceptional 9.7% |
| Menominee | 99.8 /100 | #43 | Exceptional 9.7% |
| Europeans | 99.8 /100 | #44 | Exceptional 9.7% |
| Croatians | 99.8 /100 | #45 | Exceptional 9.7% |
| Immigrants | Nicaragua | 99.8 /100 | #46 | Exceptional 9.7% |