Bangladeshi vs Cherokee Male Unemployment
COMPARE
Bangladeshi
Cherokee
Male Unemployment
Male Unemployment Comparison
Bangladeshis
Cherokee
5.7%
MALE UNEMPLOYMENT
0.8/ 100
METRIC RATING
243rd/ 347
METRIC RANK
5.6%
MALE UNEMPLOYMENT
2.4/ 100
METRIC RATING
224th/ 347
METRIC RANK
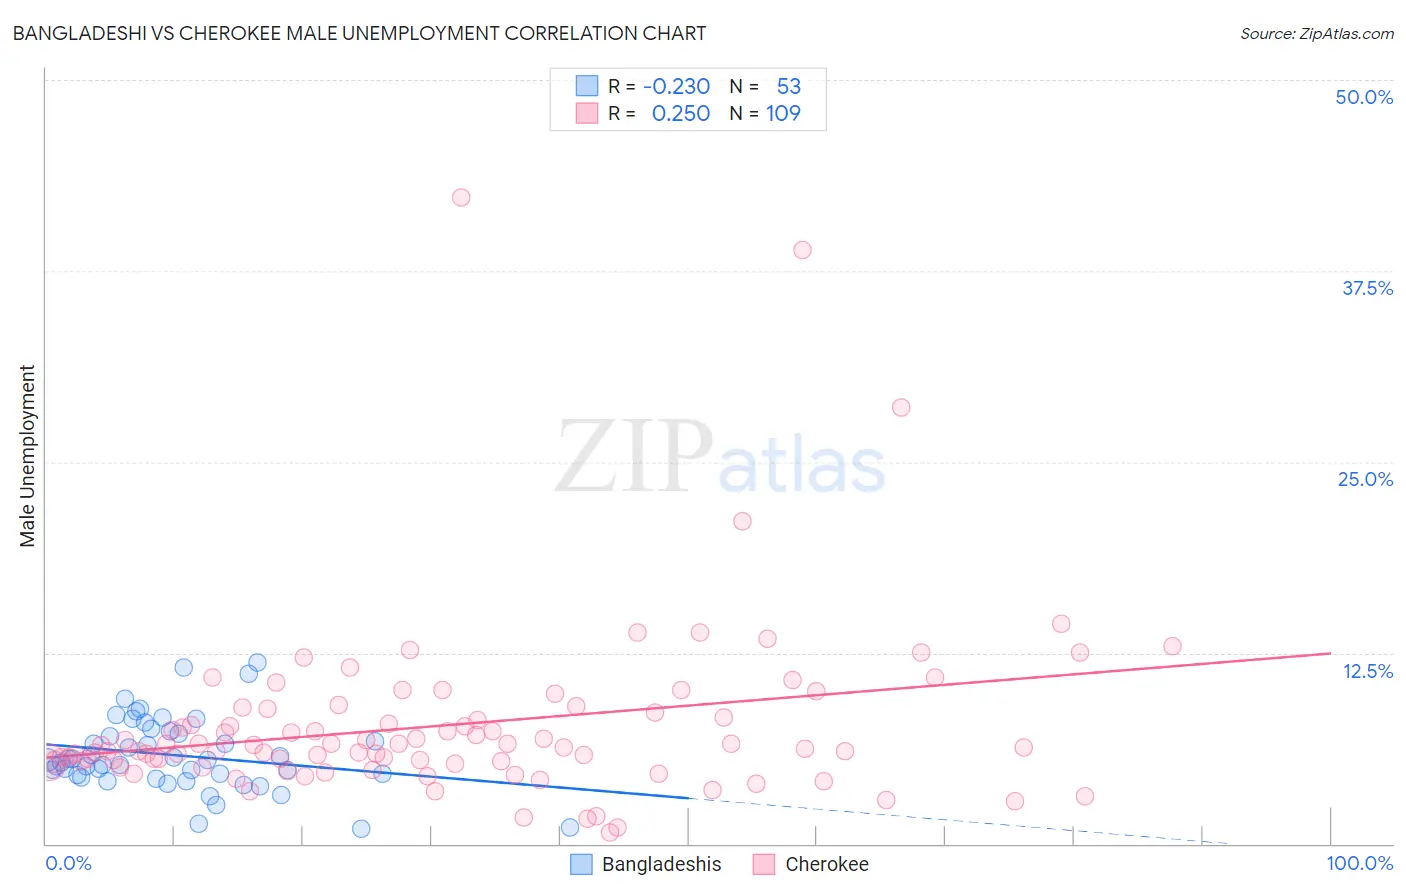
Bangladeshi vs Cherokee Male Unemployment Correlation Chart
The statistical analysis conducted on geographies consisting of 141,111,800 people shows a weak negative correlation between the proportion of Bangladeshis and unemployment rate among males in the United States with a correlation coefficient (R) of -0.230 and weighted average of 5.7%. Similarly, the statistical analysis conducted on geographies consisting of 488,550,213 people shows a weak positive correlation between the proportion of Cherokee and unemployment rate among males in the United States with a correlation coefficient (R) of 0.250 and weighted average of 5.6%, a difference of 1.6%.
Male Unemployment Correlation Summary
| Measurement | Bangladeshi | Cherokee |
| Minimum | 1.0% | 0.70% |
| Maximum | 11.9% | 42.3% |
| Range | 10.9% | 41.6% |
| Mean | 5.8% | 7.8% |
| Median | 5.5% | 6.3% |
| Interquartile 25% (IQ1) | 4.4% | 5.3% |
| Interquartile 75% (IQ3) | 7.3% | 8.7% |
| Interquartile Range (IQR) | 2.9% | 3.4% |
| Standard Deviation (Sample) | 2.4% | 5.9% |
| Standard Deviation (Population) | 2.4% | 5.9% |
Demographics Similar to Bangladeshis and Cherokee by Male Unemployment
In terms of male unemployment, the demographic groups most similar to Bangladeshis are Ottawa (5.7%, a difference of 0.28%), Salvadoran (5.7%, a difference of 0.35%), Immigrants from Cameroon (5.6%, a difference of 0.40%), Native Hawaiian (5.6%, a difference of 0.47%), and Immigrants from Guatemala (5.6%, a difference of 0.47%). Similarly, the demographic groups most similar to Cherokee are Creek (5.6%, a difference of 0.13%), Panamanian (5.6%, a difference of 0.32%), Immigrants from Cambodia (5.6%, a difference of 0.41%), Immigrants from Panama (5.6%, a difference of 0.41%), and Seminole (5.6%, a difference of 0.43%).
| Demographics | Rating | Rank | Male Unemployment |
| Creek | 2.6 /100 | #223 | Tragic 5.6% |
| Cherokee | 2.4 /100 | #224 | Tragic 5.6% |
| Panamanians | 1.9 /100 | #225 | Tragic 5.6% |
| Immigrants | Cambodia | 1.8 /100 | #226 | Tragic 5.6% |
| Immigrants | Panama | 1.8 /100 | #227 | Tragic 5.6% |
| Seminole | 1.8 /100 | #228 | Tragic 5.6% |
| Central Americans | 1.8 /100 | #229 | Tragic 5.6% |
| Immigrants | Africa | 1.7 /100 | #230 | Tragic 5.6% |
| Choctaw | 1.6 /100 | #231 | Tragic 5.6% |
| Moroccans | 1.6 /100 | #232 | Tragic 5.6% |
| Somalis | 1.5 /100 | #233 | Tragic 5.6% |
| Immigrants | Somalia | 1.5 /100 | #234 | Tragic 5.6% |
| Immigrants | Honduras | 1.5 /100 | #235 | Tragic 5.6% |
| Guatemalans | 1.2 /100 | #236 | Tragic 5.6% |
| Hondurans | 1.1 /100 | #237 | Tragic 5.6% |
| Native Hawaiians | 1.1 /100 | #238 | Tragic 5.6% |
| Immigrants | Guatemala | 1.1 /100 | #239 | Tragic 5.6% |
| Immigrants | Cameroon | 1.0 /100 | #240 | Tragic 5.6% |
| Salvadorans | 1.0 /100 | #241 | Tragic 5.7% |
| Ottawa | 0.9 /100 | #242 | Tragic 5.7% |
| Bangladeshis | 0.8 /100 | #243 | Tragic 5.7% |