Bangladeshi vs Laotian Unemployment Among Seniors over 65 years
COMPARE
Bangladeshi
Laotian
Unemployment Among Seniors over 65 years
Unemployment Among Seniors over 65 years Comparison
Bangladeshis
Laotians
5.2%
UNEMPLOYMENT AMONG SENIORS OVER 65 YEARS
32.3/ 100
METRIC RATING
189th/ 347
METRIC RANK
5.2%
UNEMPLOYMENT AMONG SENIORS OVER 65 YEARS
18.1/ 100
METRIC RATING
201st/ 347
METRIC RANK
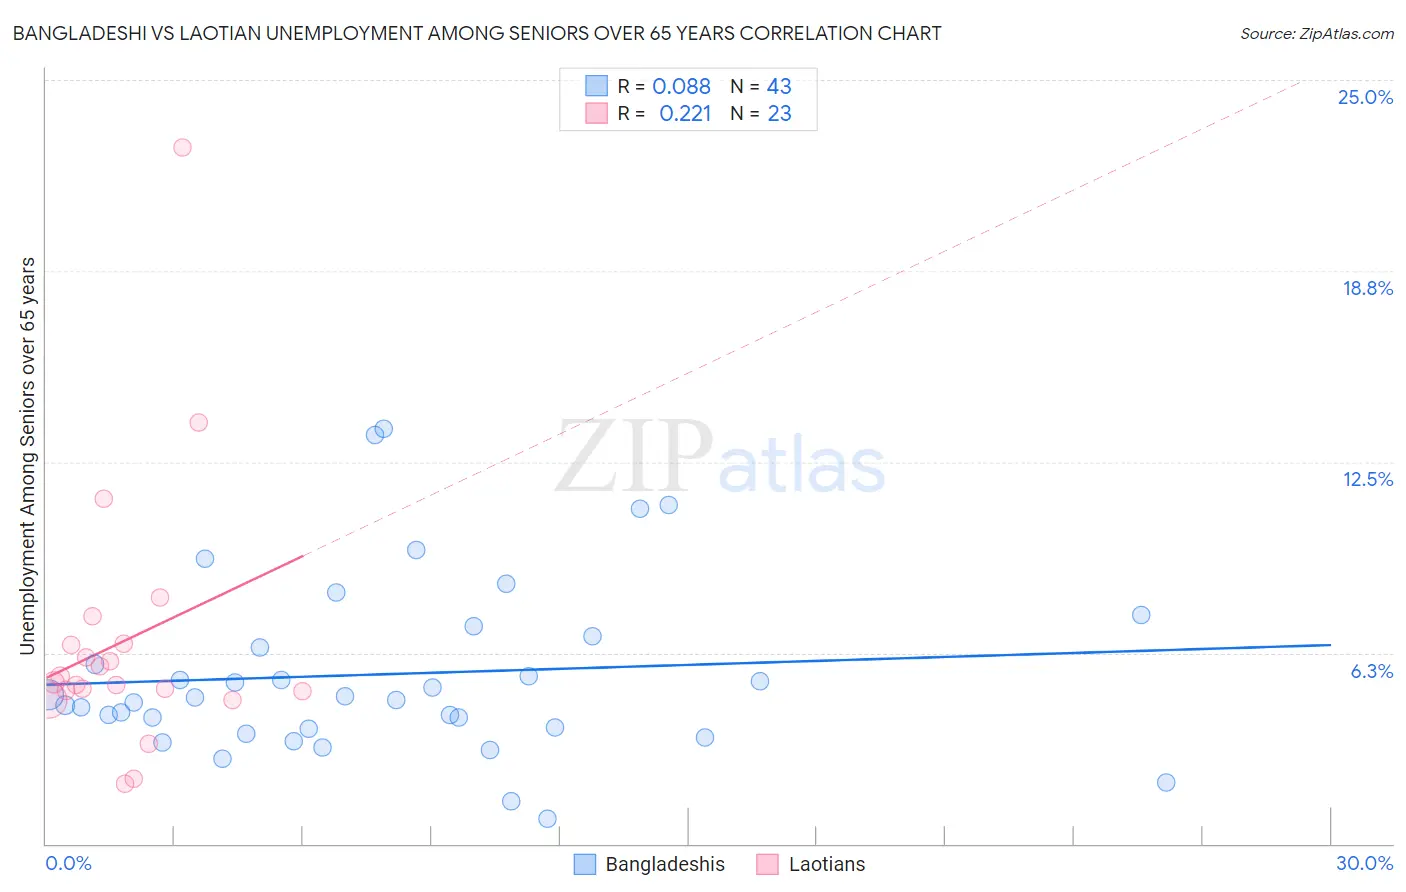
Bangladeshi vs Laotian Unemployment Among Seniors over 65 years Correlation Chart
The statistical analysis conducted on geographies consisting of 132,453,489 people shows a slight positive correlation between the proportion of Bangladeshis and unemployment rate amomg seniors over the age of 65 in the United States with a correlation coefficient (R) of 0.088 and weighted average of 5.2%. Similarly, the statistical analysis conducted on geographies consisting of 213,153,669 people shows a weak positive correlation between the proportion of Laotians and unemployment rate amomg seniors over the age of 65 in the United States with a correlation coefficient (R) of 0.221 and weighted average of 5.2%, a difference of 0.61%.
Unemployment Among Seniors over 65 years Correlation Summary
| Measurement | Bangladeshi | Laotian |
| Minimum | 0.80% | 2.0% |
| Maximum | 13.6% | 22.8% |
| Range | 12.8% | 20.8% |
| Mean | 5.6% | 6.6% |
| Median | 4.8% | 5.3% |
| Interquartile 25% (IQ1) | 3.8% | 5.0% |
| Interquartile 75% (IQ3) | 6.8% | 6.5% |
| Interquartile Range (IQR) | 3.0% | 1.5% |
| Standard Deviation (Sample) | 2.9% | 4.4% |
| Standard Deviation (Population) | 2.9% | 4.3% |
Demographics Similar to Bangladeshis and Laotians by Unemployment Among Seniors over 65 years
In terms of unemployment among seniors over 65 years, the demographic groups most similar to Bangladeshis are Korean (5.2%, a difference of 0.030%), Immigrants from Egypt (5.2%, a difference of 0.040%), Somali (5.2%, a difference of 0.050%), Immigrants from Denmark (5.2%, a difference of 0.050%), and Sioux (5.2%, a difference of 0.050%). Similarly, the demographic groups most similar to Laotians are Immigrants from Pakistan (5.2%, a difference of 0.020%), Immigrants from Northern Africa (5.2%, a difference of 0.020%), Immigrants from Europe (5.2%, a difference of 0.040%), Subsaharan African (5.2%, a difference of 0.060%), and Immigrants from China (5.2%, a difference of 0.060%).
| Demographics | Rating | Rank | Unemployment Among Seniors over 65 years |
| Immigrants | Iran | 36.0 /100 | #185 | Fair 5.2% |
| Americans | 35.1 /100 | #186 | Fair 5.2% |
| Somalis | 33.5 /100 | #187 | Fair 5.2% |
| Immigrants | Egypt | 33.2 /100 | #188 | Fair 5.2% |
| Bangladeshis | 32.3 /100 | #189 | Fair 5.2% |
| Koreans | 31.6 /100 | #190 | Fair 5.2% |
| Immigrants | Denmark | 31.0 /100 | #191 | Fair 5.2% |
| Sioux | 30.8 /100 | #192 | Fair 5.2% |
| Immigrants | Africa | 29.6 /100 | #193 | Fair 5.2% |
| Argentineans | 29.1 /100 | #194 | Fair 5.2% |
| Costa Ricans | 27.0 /100 | #195 | Fair 5.2% |
| Immigrants | Poland | 24.3 /100 | #196 | Fair 5.2% |
| Guamanians/Chamorros | 22.5 /100 | #197 | Fair 5.2% |
| Maltese | 19.6 /100 | #198 | Poor 5.2% |
| Immigrants | Europe | 19.0 /100 | #199 | Poor 5.2% |
| Immigrants | Pakistan | 18.4 /100 | #200 | Poor 5.2% |
| Laotians | 18.1 /100 | #201 | Poor 5.2% |
| Immigrants | Northern Africa | 17.7 /100 | #202 | Poor 5.2% |
| Sub-Saharan Africans | 17.1 /100 | #203 | Poor 5.2% |
| Immigrants | China | 16.9 /100 | #204 | Poor 5.2% |
| South American Indians | 15.3 /100 | #205 | Poor 5.2% |