Bangladeshi vs Laotian Unemployment Among Youth under 25 years
COMPARE
Bangladeshi
Laotian
Unemployment Among Youth under 25 years
Unemployment Among Youth under 25 years Comparison
Bangladeshis
Laotians
11.6%
UNEMPLOYMENT AMONG YOUTH UNDER 25 YEARS
55.6/ 100
METRIC RATING
171st/ 347
METRIC RANK
11.5%
UNEMPLOYMENT AMONG YOUTH UNDER 25 YEARS
72.4/ 100
METRIC RATING
147th/ 347
METRIC RANK
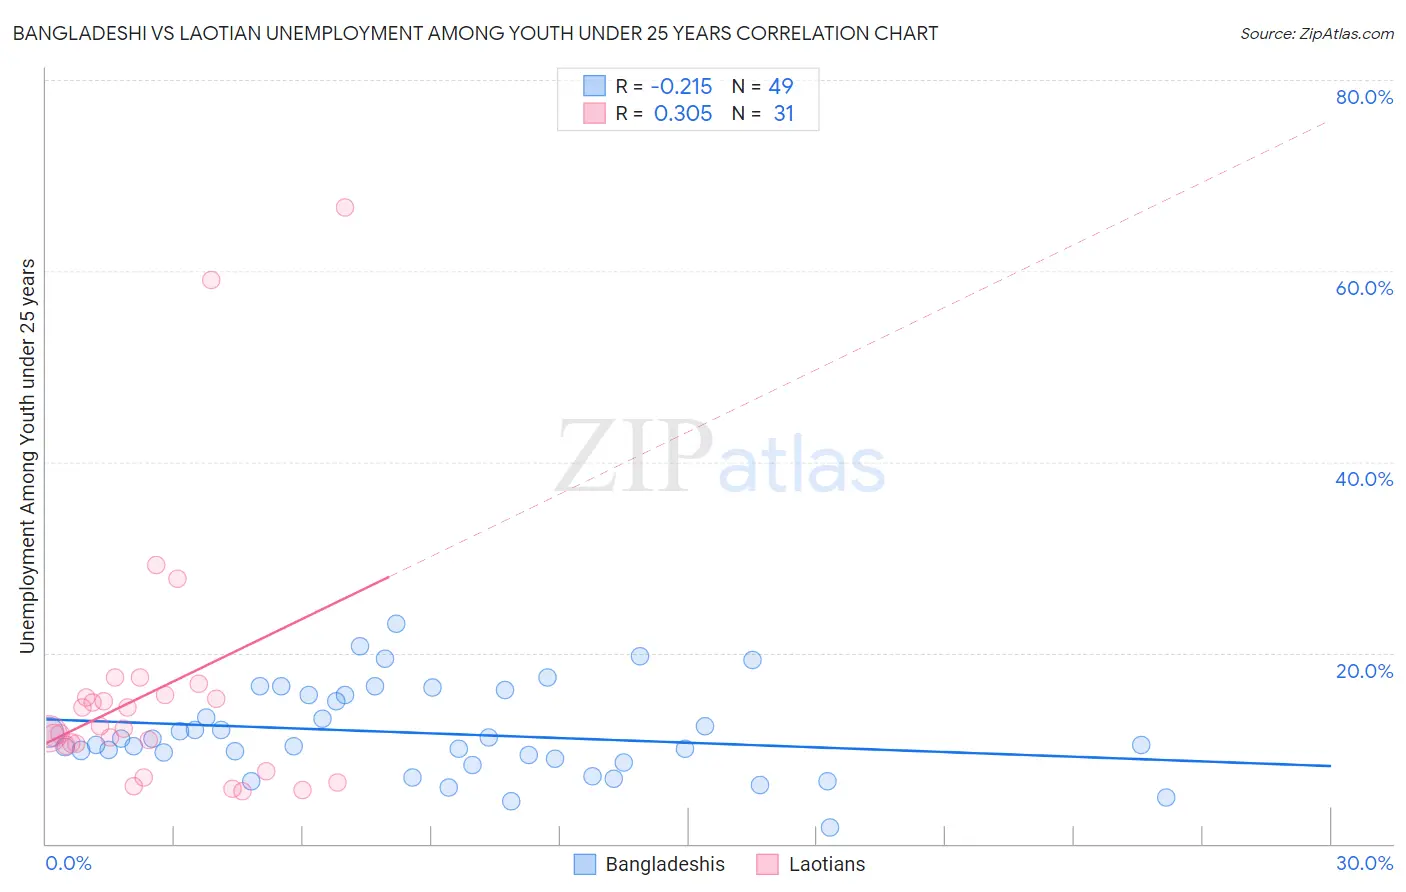
Bangladeshi vs Laotian Unemployment Among Youth under 25 years Correlation Chart
The statistical analysis conducted on geographies consisting of 140,831,540 people shows a weak negative correlation between the proportion of Bangladeshis and unemployment rate among youth under the age of 25 in the United States with a correlation coefficient (R) of -0.215 and weighted average of 11.6%. Similarly, the statistical analysis conducted on geographies consisting of 223,846,282 people shows a mild positive correlation between the proportion of Laotians and unemployment rate among youth under the age of 25 in the United States with a correlation coefficient (R) of 0.305 and weighted average of 11.5%, a difference of 0.77%.
Unemployment Among Youth under 25 years Correlation Summary
| Measurement | Bangladeshi | Laotian |
| Minimum | 1.7% | 5.5% |
| Maximum | 23.1% | 66.7% |
| Range | 21.4% | 61.2% |
| Mean | 11.6% | 15.9% |
| Median | 10.4% | 12.1% |
| Interquartile 25% (IQ1) | 8.7% | 10.3% |
| Interquartile 75% (IQ3) | 15.6% | 15.6% |
| Interquartile Range (IQR) | 6.9% | 5.3% |
| Standard Deviation (Sample) | 4.6% | 13.7% |
| Standard Deviation (Population) | 4.6% | 13.5% |
Similar Demographics by Unemployment Among Youth under 25 years
Demographics Similar to Bangladeshis by Unemployment Among Youth under 25 years
In terms of unemployment among youth under 25 years, the demographic groups most similar to Bangladeshis are Immigrants from Morocco (11.6%, a difference of 0.020%), Russian (11.6%, a difference of 0.070%), Eastern European (11.6%, a difference of 0.080%), Potawatomi (11.6%, a difference of 0.10%), and Okinawan (11.6%, a difference of 0.13%).
| Demographics | Rating | Rank | Unemployment Among Youth under 25 years |
| Immigrants | Laos | 62.4 /100 | #164 | Good 11.5% |
| Immigrants | Sweden | 61.3 /100 | #165 | Good 11.5% |
| Spanish | 60.3 /100 | #166 | Good 11.6% |
| Okinawans | 58.7 /100 | #167 | Average 11.6% |
| Potawatomi | 57.9 /100 | #168 | Average 11.6% |
| Eastern Europeans | 57.5 /100 | #169 | Average 11.6% |
| Russians | 57.3 /100 | #170 | Average 11.6% |
| Bangladeshis | 55.6 /100 | #171 | Average 11.6% |
| Immigrants | Morocco | 55.1 /100 | #172 | Average 11.6% |
| Immigrants | South Eastern Asia | 51.7 /100 | #173 | Average 11.6% |
| Immigrants | China | 50.0 /100 | #174 | Average 11.6% |
| Immigrants | Iraq | 47.0 /100 | #175 | Average 11.6% |
| Ugandans | 45.6 /100 | #176 | Average 11.6% |
| Immigrants | Denmark | 45.0 /100 | #177 | Average 11.6% |
| Immigrants | Europe | 42.4 /100 | #178 | Average 11.6% |
Demographics Similar to Laotians by Unemployment Among Youth under 25 years
In terms of unemployment among youth under 25 years, the demographic groups most similar to Laotians are Brazilian (11.5%, a difference of 0.0%), Immigrants from Northern Europe (11.5%, a difference of 0.020%), Argentinean (11.5%, a difference of 0.030%), Immigrants from Cambodia (11.5%, a difference of 0.030%), and Immigrants from Switzerland (11.5%, a difference of 0.040%).
| Demographics | Rating | Rank | Unemployment Among Youth under 25 years |
| Immigrants | Belgium | 77.5 /100 | #140 | Good 11.5% |
| Immigrants | Uruguay | 76.1 /100 | #141 | Good 11.5% |
| Immigrants | Korea | 75.1 /100 | #142 | Good 11.5% |
| Immigrants | Uganda | 74.5 /100 | #143 | Good 11.5% |
| Immigrants | Brazil | 74.3 /100 | #144 | Good 11.5% |
| Argentineans | 73.0 /100 | #145 | Good 11.5% |
| Brazilians | 72.5 /100 | #146 | Good 11.5% |
| Laotians | 72.4 /100 | #147 | Good 11.5% |
| Immigrants | Northern Europe | 72.1 /100 | #148 | Good 11.5% |
| Immigrants | Cambodia | 71.8 /100 | #149 | Good 11.5% |
| Immigrants | Switzerland | 71.6 /100 | #150 | Good 11.5% |
| Uruguayans | 70.4 /100 | #151 | Good 11.5% |
| Iraqis | 68.3 /100 | #152 | Good 11.5% |
| Immigrants | Czechoslovakia | 67.1 /100 | #153 | Good 11.5% |
| Immigrants | Asia | 66.7 /100 | #154 | Good 11.5% |