Immigrants from South Eastern Asia vs Laotian Unemployment Among Seniors over 65 years
COMPARE
Immigrants from South Eastern Asia
Laotian
Unemployment Among Seniors over 65 years
Unemployment Among Seniors over 65 years Comparison
Immigrants from South Eastern Asia
Laotians
5.1%
UNEMPLOYMENT AMONG SENIORS OVER 65 YEARS
65.6/ 100
METRIC RATING
162nd/ 347
METRIC RANK
5.2%
UNEMPLOYMENT AMONG SENIORS OVER 65 YEARS
18.1/ 100
METRIC RATING
201st/ 347
METRIC RANK
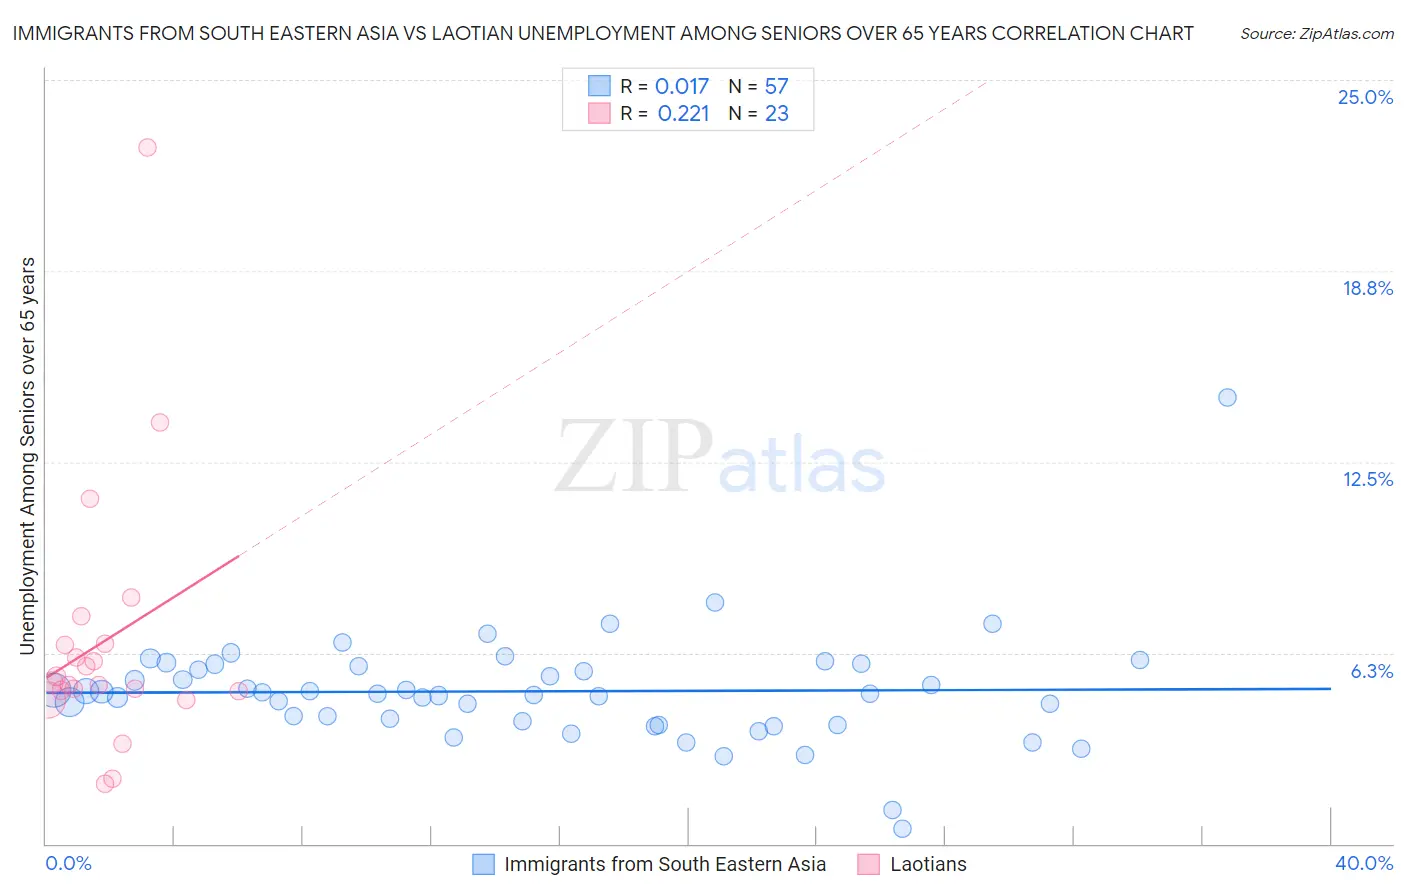
Immigrants from South Eastern Asia vs Laotian Unemployment Among Seniors over 65 years Correlation Chart
The statistical analysis conducted on geographies consisting of 438,289,395 people shows no correlation between the proportion of Immigrants from South Eastern Asia and unemployment rate amomg seniors over the age of 65 in the United States with a correlation coefficient (R) of 0.017 and weighted average of 5.1%. Similarly, the statistical analysis conducted on geographies consisting of 213,153,669 people shows a weak positive correlation between the proportion of Laotians and unemployment rate amomg seniors over the age of 65 in the United States with a correlation coefficient (R) of 0.221 and weighted average of 5.2%, a difference of 1.7%.
Unemployment Among Seniors over 65 years Correlation Summary
| Measurement | Immigrants from South Eastern Asia | Laotian |
| Minimum | 0.50% | 2.0% |
| Maximum | 14.6% | 22.8% |
| Range | 14.1% | 20.8% |
| Mean | 5.0% | 6.6% |
| Median | 4.9% | 5.3% |
| Interquartile 25% (IQ1) | 3.9% | 5.0% |
| Interquartile 75% (IQ3) | 5.8% | 6.5% |
| Interquartile Range (IQR) | 1.9% | 1.5% |
| Standard Deviation (Sample) | 1.9% | 4.4% |
| Standard Deviation (Population) | 1.9% | 4.3% |
Similar Demographics by Unemployment Among Seniors over 65 years
Demographics Similar to Immigrants from South Eastern Asia by Unemployment Among Seniors over 65 years
In terms of unemployment among seniors over 65 years, the demographic groups most similar to Immigrants from South Eastern Asia are Immigrants from Bosnia and Herzegovina (5.1%, a difference of 0.020%), Potawatomi (5.1%, a difference of 0.040%), Nepalese (5.1%, a difference of 0.040%), Immigrants from Ukraine (5.1%, a difference of 0.050%), and Immigrants from Laos (5.1%, a difference of 0.060%).
| Demographics | Rating | Rank | Unemployment Among Seniors over 65 years |
| Basques | 72.9 /100 | #155 | Good 5.1% |
| Immigrants | Romania | 72.4 /100 | #156 | Good 5.1% |
| Immigrants | Northern Europe | 69.8 /100 | #157 | Good 5.1% |
| Immigrants | Belarus | 69.0 /100 | #158 | Good 5.1% |
| Immigrants | France | 68.6 /100 | #159 | Good 5.1% |
| French | 68.1 /100 | #160 | Good 5.1% |
| Immigrants | Bosnia and Herzegovina | 66.1 /100 | #161 | Good 5.1% |
| Immigrants | South Eastern Asia | 65.6 /100 | #162 | Good 5.1% |
| Potawatomi | 64.5 /100 | #163 | Good 5.1% |
| Nepalese | 64.5 /100 | #164 | Good 5.1% |
| Immigrants | Ukraine | 64.2 /100 | #165 | Good 5.1% |
| Immigrants | Laos | 63.8 /100 | #166 | Good 5.1% |
| Immigrants | Western Europe | 60.4 /100 | #167 | Good 5.1% |
| Mongolians | 59.8 /100 | #168 | Average 5.1% |
| Lithuanians | 58.2 /100 | #169 | Average 5.1% |
Demographics Similar to Laotians by Unemployment Among Seniors over 65 years
In terms of unemployment among seniors over 65 years, the demographic groups most similar to Laotians are Immigrants from Pakistan (5.2%, a difference of 0.020%), Immigrants from Northern Africa (5.2%, a difference of 0.020%), Immigrants from Europe (5.2%, a difference of 0.040%), Subsaharan African (5.2%, a difference of 0.060%), and Immigrants from China (5.2%, a difference of 0.060%).
| Demographics | Rating | Rank | Unemployment Among Seniors over 65 years |
| Argentineans | 29.1 /100 | #194 | Fair 5.2% |
| Costa Ricans | 27.0 /100 | #195 | Fair 5.2% |
| Immigrants | Poland | 24.3 /100 | #196 | Fair 5.2% |
| Guamanians/Chamorros | 22.5 /100 | #197 | Fair 5.2% |
| Maltese | 19.6 /100 | #198 | Poor 5.2% |
| Immigrants | Europe | 19.0 /100 | #199 | Poor 5.2% |
| Immigrants | Pakistan | 18.4 /100 | #200 | Poor 5.2% |
| Laotians | 18.1 /100 | #201 | Poor 5.2% |
| Immigrants | Northern Africa | 17.7 /100 | #202 | Poor 5.2% |
| Sub-Saharan Africans | 17.1 /100 | #203 | Poor 5.2% |
| Immigrants | China | 16.9 /100 | #204 | Poor 5.2% |
| South American Indians | 15.3 /100 | #205 | Poor 5.2% |
| German Russians | 14.7 /100 | #206 | Poor 5.2% |
| Immigrants | Philippines | 13.2 /100 | #207 | Poor 5.2% |
| Uruguayans | 12.6 /100 | #208 | Poor 5.2% |