Bangladeshi vs Immigrants from Western Africa Unemployment Among Women with Children Under 18 years
COMPARE
Bangladeshi
Immigrants from Western Africa
Unemployment Among Women with Children Under 18 years
Unemployment Among Women with Children Under 18 years Comparison
Bangladeshis
Immigrants from Western Africa
5.3%
UNEMPLOYMENT AMONG WOMEN WITH CHILDREN UNDER 18 YEARS
73.2/ 100
METRIC RATING
147th/ 347
METRIC RANK
6.2%
UNEMPLOYMENT AMONG WOMEN WITH CHILDREN UNDER 18 YEARS
0.0/ 100
METRIC RATING
273rd/ 347
METRIC RANK
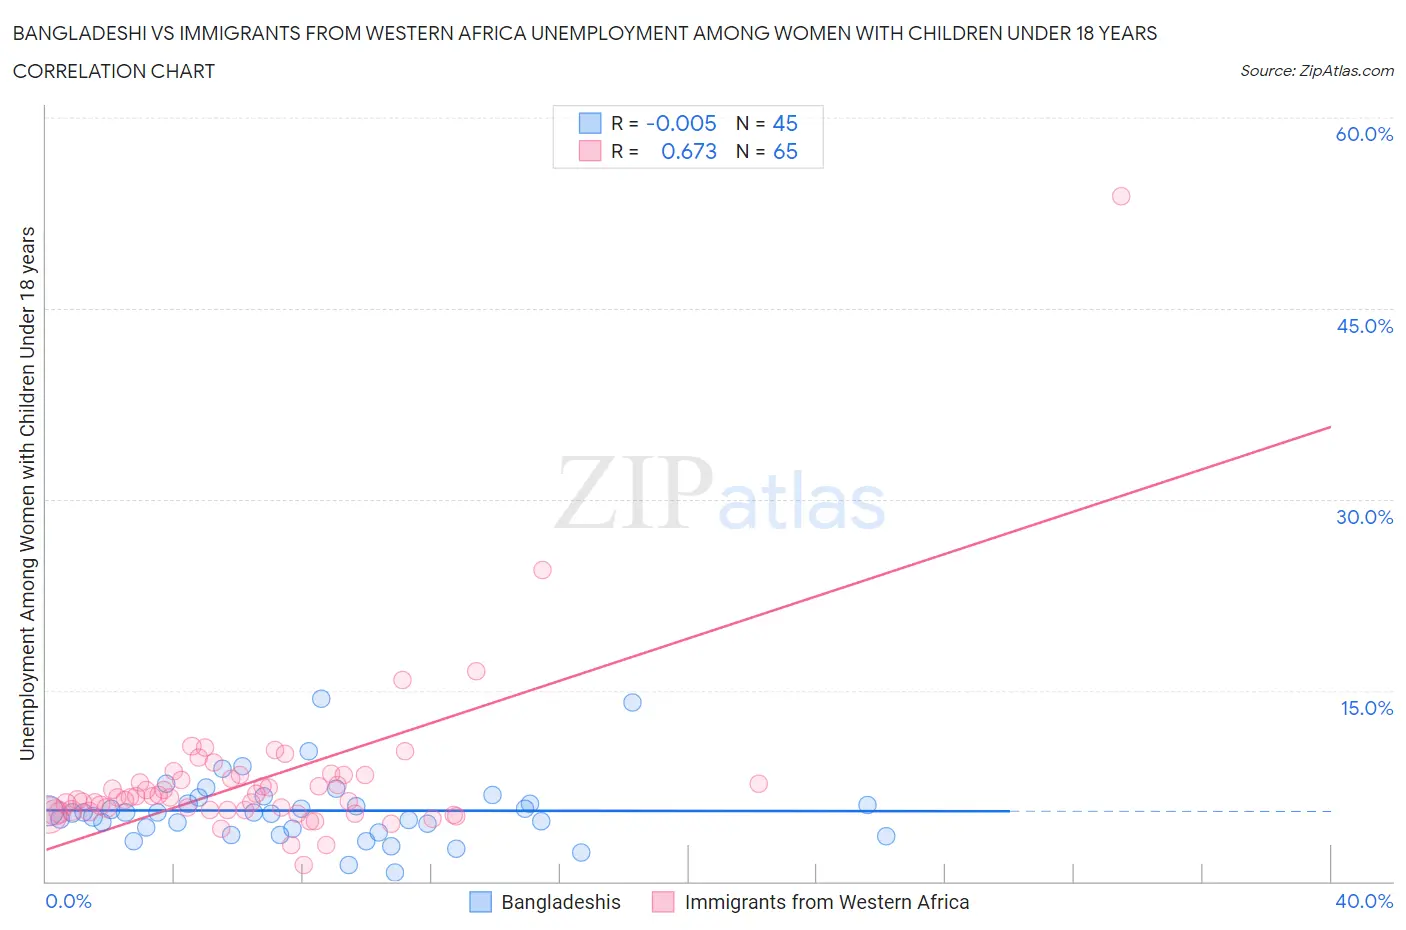
Bangladeshi vs Immigrants from Western Africa Unemployment Among Women with Children Under 18 years Correlation Chart
The statistical analysis conducted on geographies consisting of 138,843,542 people shows no correlation between the proportion of Bangladeshis and unemployment rate among women with children under the age of 18 in the United States with a correlation coefficient (R) of -0.005 and weighted average of 5.3%. Similarly, the statistical analysis conducted on geographies consisting of 348,138,775 people shows a significant positive correlation between the proportion of Immigrants from Western Africa and unemployment rate among women with children under the age of 18 in the United States with a correlation coefficient (R) of 0.673 and weighted average of 6.2%, a difference of 16.1%.
Unemployment Among Women with Children Under 18 years Correlation Summary
| Measurement | Bangladeshi | Immigrants from Western Africa |
| Minimum | 0.70% | 1.3% |
| Maximum | 14.4% | 53.8% |
| Range | 13.7% | 52.5% |
| Mean | 5.5% | 7.9% |
| Median | 5.4% | 6.6% |
| Interquartile 25% (IQ1) | 3.9% | 5.5% |
| Interquartile 75% (IQ3) | 6.4% | 8.2% |
| Interquartile Range (IQR) | 2.4% | 2.6% |
| Standard Deviation (Sample) | 2.7% | 6.6% |
| Standard Deviation (Population) | 2.6% | 6.6% |
Similar Demographics by Unemployment Among Women with Children Under 18 years
Demographics Similar to Bangladeshis by Unemployment Among Women with Children Under 18 years
In terms of unemployment among women with children under 18 years, the demographic groups most similar to Bangladeshis are Immigrants from Belarus (5.3%, a difference of 0.020%), Immigrants from Western Europe (5.4%, a difference of 0.030%), Immigrants from Egypt (5.3%, a difference of 0.070%), Immigrants from Kenya (5.4%, a difference of 0.090%), and Immigrants from Argentina (5.4%, a difference of 0.13%).
| Demographics | Rating | Rank | Unemployment Among Women with Children Under 18 years |
| Immigrants | Norway | 76.2 /100 | #140 | Good 5.3% |
| Venezuelans | 76.0 /100 | #141 | Good 5.3% |
| Immigrants | Venezuela | 75.4 /100 | #142 | Good 5.3% |
| Chileans | 75.0 /100 | #143 | Good 5.3% |
| Immigrants | England | 74.9 /100 | #144 | Good 5.3% |
| Immigrants | Egypt | 74.0 /100 | #145 | Good 5.3% |
| Immigrants | Belarus | 73.4 /100 | #146 | Good 5.3% |
| Bangladeshis | 73.2 /100 | #147 | Good 5.3% |
| Immigrants | Western Europe | 72.8 /100 | #148 | Good 5.4% |
| Immigrants | Kenya | 72.2 /100 | #149 | Good 5.4% |
| Immigrants | Argentina | 71.7 /100 | #150 | Good 5.4% |
| Immigrants | Iran | 71.1 /100 | #151 | Good 5.4% |
| Immigrants | South Eastern Asia | 71.1 /100 | #152 | Good 5.4% |
| Carpatho Rusyns | 70.8 /100 | #153 | Good 5.4% |
| Immigrants | Latvia | 70.8 /100 | #154 | Good 5.4% |
Demographics Similar to Immigrants from Western Africa by Unemployment Among Women with Children Under 18 years
In terms of unemployment among women with children under 18 years, the demographic groups most similar to Immigrants from Western Africa are Senegalese (6.2%, a difference of 0.020%), Salvadoran (6.2%, a difference of 0.090%), Dutch West Indian (6.2%, a difference of 0.19%), Immigrants from Ghana (6.2%, a difference of 0.30%), and Central American (6.2%, a difference of 0.31%).
| Demographics | Rating | Rank | Unemployment Among Women with Children Under 18 years |
| Sub-Saharan Africans | 0.1 /100 | #266 | Tragic 6.2% |
| French American Indians | 0.1 /100 | #267 | Tragic 6.2% |
| Trinidadians and Tobagonians | 0.1 /100 | #268 | Tragic 6.2% |
| Cajuns | 0.1 /100 | #269 | Tragic 6.2% |
| Ghanaians | 0.1 /100 | #270 | Tragic 6.2% |
| Central Americans | 0.0 /100 | #271 | Tragic 6.2% |
| Salvadorans | 0.0 /100 | #272 | Tragic 6.2% |
| Immigrants | Western Africa | 0.0 /100 | #273 | Tragic 6.2% |
| Senegalese | 0.0 /100 | #274 | Tragic 6.2% |
| Dutch West Indians | 0.0 /100 | #275 | Tragic 6.2% |
| Immigrants | Ghana | 0.0 /100 | #276 | Tragic 6.2% |
| Mexican American Indians | 0.0 /100 | #277 | Tragic 6.2% |
| Immigrants | Barbados | 0.0 /100 | #278 | Tragic 6.2% |
| Immigrants | Portugal | 0.0 /100 | #279 | Tragic 6.3% |
| Guatemalans | 0.0 /100 | #280 | Tragic 6.3% |