Immigrants from Eastern Africa vs Okinawan Unemployment
COMPARE
Immigrants from Eastern Africa
Okinawan
Unemployment
Unemployment Comparison
Immigrants from Eastern Africa
Okinawans
5.1%
UNEMPLOYMENT
88.1/ 100
METRIC RATING
128th/ 347
METRIC RANK
4.9%
UNEMPLOYMENT
97.9/ 100
METRIC RATING
78th/ 347
METRIC RANK
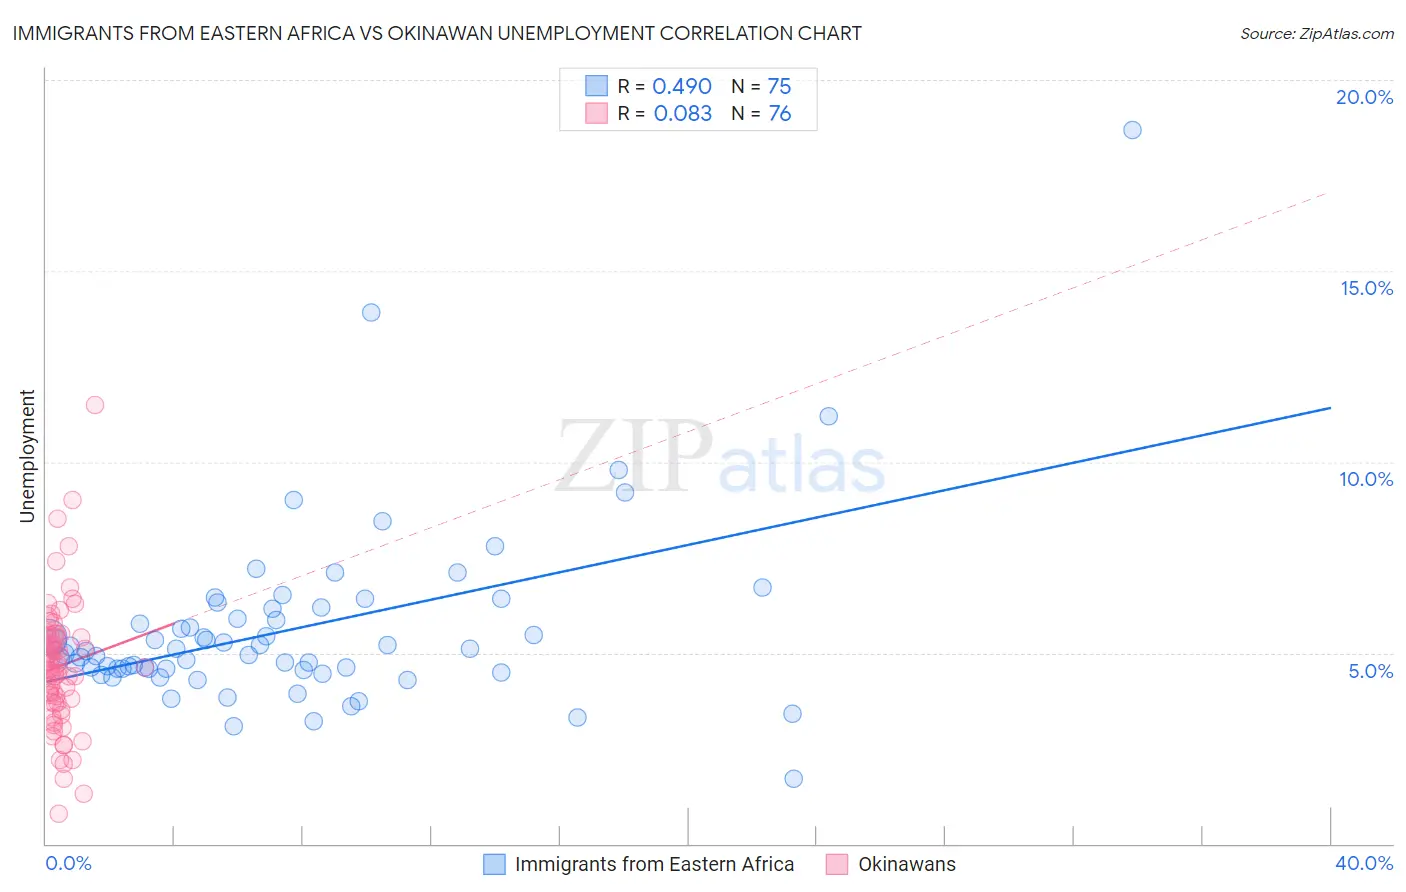
Immigrants from Eastern Africa vs Okinawan Unemployment Correlation Chart
The statistical analysis conducted on geographies consisting of 354,902,578 people shows a moderate positive correlation between the proportion of Immigrants from Eastern Africa and unemployment in the United States with a correlation coefficient (R) of 0.490 and weighted average of 5.1%. Similarly, the statistical analysis conducted on geographies consisting of 73,771,070 people shows a slight positive correlation between the proportion of Okinawans and unemployment in the United States with a correlation coefficient (R) of 0.083 and weighted average of 4.9%, a difference of 3.0%.
Unemployment Correlation Summary
| Measurement | Immigrants from Eastern Africa | Okinawan |
| Minimum | 1.7% | 0.80% |
| Maximum | 18.7% | 11.5% |
| Range | 17.0% | 10.7% |
| Mean | 5.6% | 4.6% |
| Median | 5.0% | 4.6% |
| Interquartile 25% (IQ1) | 4.6% | 3.7% |
| Interquartile 75% (IQ3) | 6.1% | 5.5% |
| Interquartile Range (IQR) | 1.6% | 1.8% |
| Standard Deviation (Sample) | 2.4% | 1.7% |
| Standard Deviation (Population) | 2.4% | 1.7% |
Similar Demographics by Unemployment
Demographics Similar to Immigrants from Eastern Africa by Unemployment
In terms of unemployment, the demographic groups most similar to Immigrants from Eastern Africa are Immigrants from Latvia (5.1%, a difference of 0.0%), Kenyan (5.1%, a difference of 0.020%), Immigrants from Kenya (5.1%, a difference of 0.020%), Immigrants from Eastern Asia (5.1%, a difference of 0.040%), and Ethiopian (5.1%, a difference of 0.090%).
| Demographics | Rating | Rank | Unemployment |
| Lebanese | 89.2 /100 | #121 | Excellent 5.1% |
| Immigrants | Switzerland | 89.1 /100 | #122 | Excellent 5.1% |
| Asians | 89.0 /100 | #123 | Excellent 5.1% |
| Ethiopians | 88.6 /100 | #124 | Excellent 5.1% |
| Immigrants | Eastern Asia | 88.3 /100 | #125 | Excellent 5.1% |
| Kenyans | 88.2 /100 | #126 | Excellent 5.1% |
| Immigrants | Kenya | 88.2 /100 | #127 | Excellent 5.1% |
| Immigrants | Eastern Africa | 88.1 /100 | #128 | Excellent 5.1% |
| Immigrants | Latvia | 88.0 /100 | #129 | Excellent 5.1% |
| Iranians | 86.9 /100 | #130 | Excellent 5.1% |
| Immigrants | Croatia | 86.8 /100 | #131 | Excellent 5.1% |
| Immigrants | Ethiopia | 86.7 /100 | #132 | Excellent 5.1% |
| Immigrants | Jordan | 86.6 /100 | #133 | Excellent 5.1% |
| Immigrants | Europe | 86.3 /100 | #134 | Excellent 5.1% |
| Immigrants | Burma/Myanmar | 86.2 /100 | #135 | Excellent 5.1% |
Demographics Similar to Okinawans by Unemployment
In terms of unemployment, the demographic groups most similar to Okinawans are Cypriot (4.9%, a difference of 0.040%), German Russian (4.9%, a difference of 0.10%), Canadian (5.0%, a difference of 0.12%), Turkish (4.9%, a difference of 0.13%), and Immigrants from Sweden (5.0%, a difference of 0.19%).
| Demographics | Rating | Rank | Unemployment |
| Immigrants | Japan | 98.3 /100 | #71 | Exceptional 4.9% |
| Burmese | 98.3 /100 | #72 | Exceptional 4.9% |
| Paraguayans | 98.3 /100 | #73 | Exceptional 4.9% |
| Immigrants | Northern Europe | 98.2 /100 | #74 | Exceptional 4.9% |
| Turks | 98.0 /100 | #75 | Exceptional 4.9% |
| German Russians | 98.0 /100 | #76 | Exceptional 4.9% |
| Cypriots | 97.9 /100 | #77 | Exceptional 4.9% |
| Okinawans | 97.9 /100 | #78 | Exceptional 4.9% |
| Canadians | 97.7 /100 | #79 | Exceptional 5.0% |
| Immigrants | Sweden | 97.6 /100 | #80 | Exceptional 5.0% |
| Basques | 97.6 /100 | #81 | Exceptional 5.0% |
| Fijians | 97.6 /100 | #82 | Exceptional 5.0% |
| Hmong | 97.6 /100 | #83 | Exceptional 5.0% |
| Russians | 97.4 /100 | #84 | Exceptional 5.0% |
| Immigrants | Australia | 97.0 /100 | #85 | Exceptional 5.0% |