Australian vs Native/Alaskan Divorced or Separated
COMPARE
Australian
Native/Alaskan
Divorced or Separated
Divorced or Separated Comparison
Australians
Natives/Alaskans
11.9%
DIVORCED OR SEPARATED
83.6/ 100
METRIC RATING
139th/ 347
METRIC RANK
13.0%
DIVORCED OR SEPARATED
0.0/ 100
METRIC RATING
297th/ 347
METRIC RANK
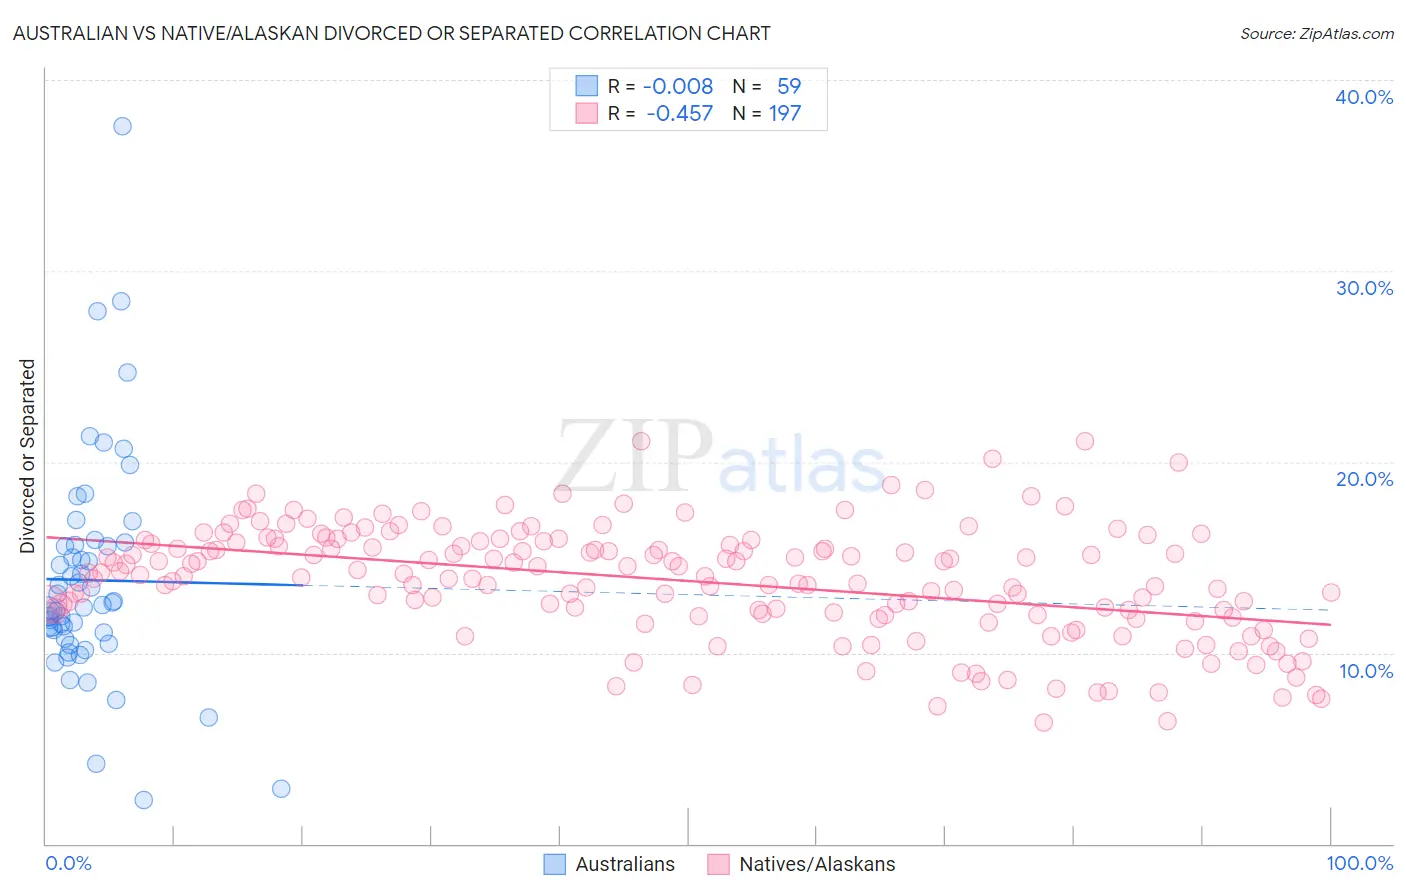
Australian vs Native/Alaskan Divorced or Separated Correlation Chart
The statistical analysis conducted on geographies consisting of 224,067,628 people shows no correlation between the proportion of Australians and percentage of population currently divorced or separated in the United States with a correlation coefficient (R) of -0.008 and weighted average of 11.9%. Similarly, the statistical analysis conducted on geographies consisting of 512,782,555 people shows a moderate negative correlation between the proportion of Natives/Alaskans and percentage of population currently divorced or separated in the United States with a correlation coefficient (R) of -0.457 and weighted average of 13.0%, a difference of 9.5%.
Divorced or Separated Correlation Summary
| Measurement | Australian | Native/Alaskan |
| Minimum | 2.3% | 6.3% |
| Maximum | 37.6% | 21.1% |
| Range | 35.3% | 14.8% |
| Mean | 13.8% | 13.8% |
| Median | 12.5% | 14.1% |
| Interquartile 25% (IQ1) | 10.8% | 12.0% |
| Interquartile 75% (IQ3) | 15.6% | 15.8% |
| Interquartile Range (IQR) | 4.9% | 3.8% |
| Standard Deviation (Sample) | 5.9% | 2.9% |
| Standard Deviation (Population) | 5.9% | 2.9% |
Similar Demographics by Divorced or Separated
Demographics Similar to Australians by Divorced or Separated
In terms of divorced or separated, the demographic groups most similar to Australians are Alsatian (11.9%, a difference of 0.020%), Immigrants from Netherlands (11.9%, a difference of 0.020%), Lebanese (11.9%, a difference of 0.020%), Immigrants from Morocco (11.9%, a difference of 0.050%), and Danish (11.9%, a difference of 0.080%).
| Demographics | Rating | Rank | Divorced or Separated |
| Immigrants | Afghanistan | 87.9 /100 | #132 | Excellent 11.8% |
| New Zealanders | 87.5 /100 | #133 | Excellent 11.9% |
| Argentineans | 85.1 /100 | #134 | Excellent 11.9% |
| Danes | 84.8 /100 | #135 | Excellent 11.9% |
| Carpatho Rusyns | 84.8 /100 | #136 | Excellent 11.9% |
| Alsatians | 84.0 /100 | #137 | Excellent 11.9% |
| Immigrants | Netherlands | 83.9 /100 | #138 | Excellent 11.9% |
| Australians | 83.6 /100 | #139 | Excellent 11.9% |
| Lebanese | 83.4 /100 | #140 | Excellent 11.9% |
| Immigrants | Morocco | 82.9 /100 | #141 | Excellent 11.9% |
| Immigrants | Zimbabwe | 81.5 /100 | #142 | Excellent 11.9% |
| Pakistanis | 81.3 /100 | #143 | Excellent 11.9% |
| Peruvians | 80.9 /100 | #144 | Excellent 11.9% |
| Croatians | 80.6 /100 | #145 | Excellent 11.9% |
| Immigrants | Grenada | 79.1 /100 | #146 | Good 11.9% |
Demographics Similar to Natives/Alaskans by Divorced or Separated
In terms of divorced or separated, the demographic groups most similar to Natives/Alaskans are Nicaraguan (13.0%, a difference of 0.050%), Venezuelan (13.0%, a difference of 0.070%), Immigrants from Jamaica (13.0%, a difference of 0.10%), Celtic (13.0%, a difference of 0.47%), and Apache (12.9%, a difference of 0.60%).
| Demographics | Rating | Rank | Divorced or Separated |
| Pima | 0.0 /100 | #290 | Tragic 12.9% |
| Immigrants | Honduras | 0.0 /100 | #291 | Tragic 12.9% |
| Scotch-Irish | 0.0 /100 | #292 | Tragic 12.9% |
| Jamaicans | 0.0 /100 | #293 | Tragic 12.9% |
| Apache | 0.0 /100 | #294 | Tragic 12.9% |
| Celtics | 0.0 /100 | #295 | Tragic 13.0% |
| Nicaraguans | 0.0 /100 | #296 | Tragic 13.0% |
| Natives/Alaskans | 0.0 /100 | #297 | Tragic 13.0% |
| Venezuelans | 0.0 /100 | #298 | Tragic 13.0% |
| Immigrants | Jamaica | 0.0 /100 | #299 | Tragic 13.0% |
| Immigrants | Cabo Verde | 0.0 /100 | #300 | Tragic 13.1% |
| Alaskan Athabascans | 0.0 /100 | #301 | Tragic 13.1% |
| Immigrants | Venezuela | 0.0 /100 | #302 | Tragic 13.1% |
| Cape Verdeans | 0.0 /100 | #303 | Tragic 13.1% |
| Hopi | 0.0 /100 | #304 | Tragic 13.2% |