Assyrian/Chaldean/Syriac vs Venezuelan Unemployment Among Ages 35 to 44 years
COMPARE
Assyrian/Chaldean/Syriac
Venezuelan
Unemployment Among Ages 35 to 44 years
Unemployment Among Ages 35 to 44 years Comparison
Assyrians/Chaldeans/Syriacs
Venezuelans
4.3%
UNEMPLOYMENT AMONG AGES 35 TO 44 YEARS
99.3/ 100
METRIC RATING
27th/ 347
METRIC RANK
4.1%
UNEMPLOYMENT AMONG AGES 35 TO 44 YEARS
99.9/ 100
METRIC RATING
12th/ 347
METRIC RANK
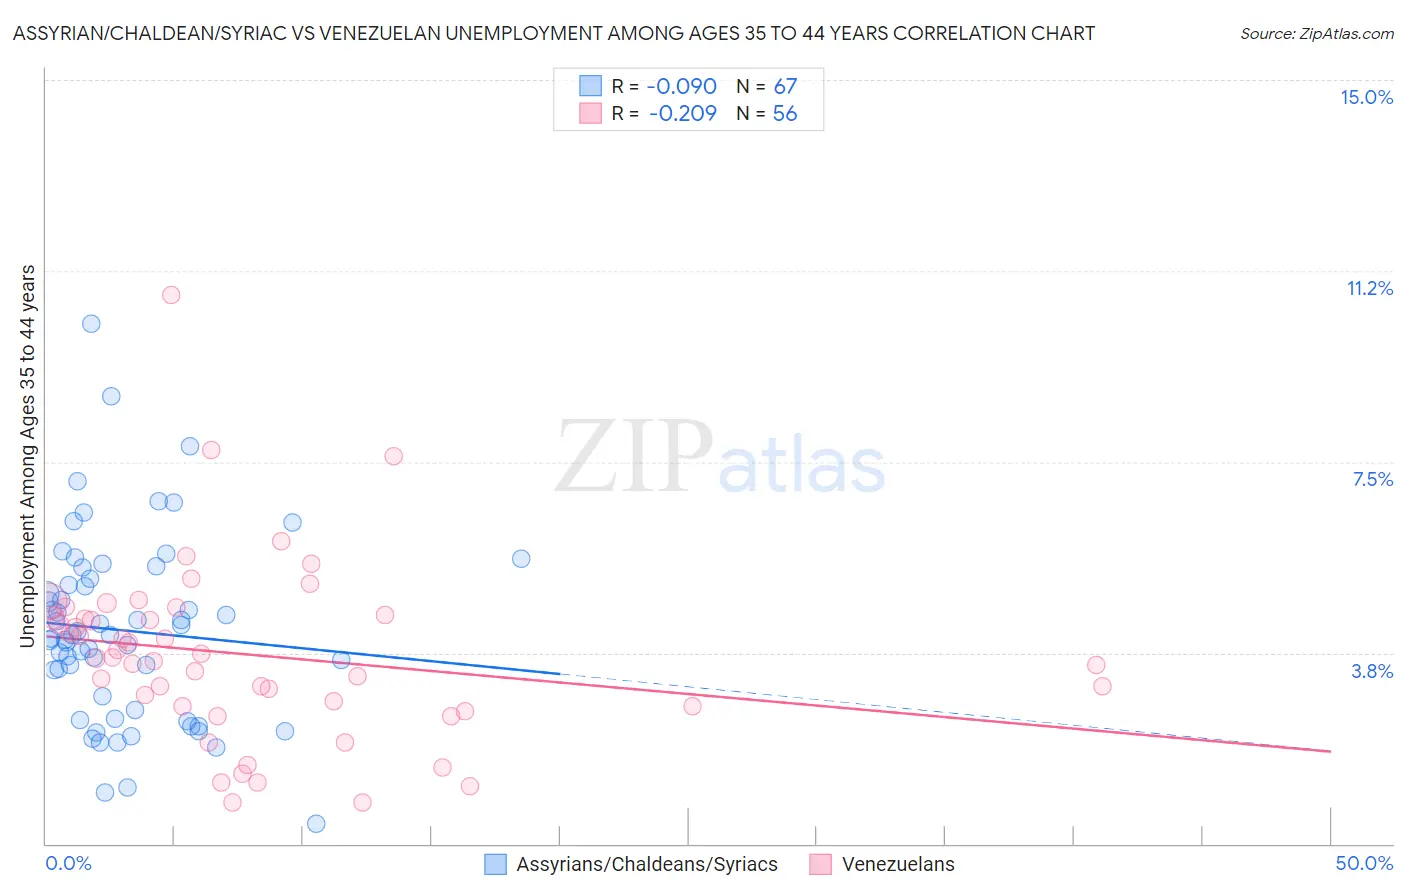
Assyrian/Chaldean/Syriac vs Venezuelan Unemployment Among Ages 35 to 44 years Correlation Chart
The statistical analysis conducted on geographies consisting of 109,865,928 people shows a slight negative correlation between the proportion of Assyrians/Chaldeans/Syriacs and unemployment rate among population between the ages 35 and 44 in the United States with a correlation coefficient (R) of -0.090 and weighted average of 4.3%. Similarly, the statistical analysis conducted on geographies consisting of 302,128,161 people shows a weak negative correlation between the proportion of Venezuelans and unemployment rate among population between the ages 35 and 44 in the United States with a correlation coefficient (R) of -0.209 and weighted average of 4.1%, a difference of 3.3%.
Unemployment Among Ages 35 to 44 years Correlation Summary
| Measurement | Assyrian/Chaldean/Syriac | Venezuelan |
| Minimum | 0.40% | 0.80% |
| Maximum | 10.2% | 10.8% |
| Range | 9.8% | 10.0% |
| Mean | 4.2% | 3.7% |
| Median | 4.1% | 3.7% |
| Interquartile 25% (IQ1) | 2.6% | 2.7% |
| Interquartile 75% (IQ3) | 5.2% | 4.5% |
| Interquartile Range (IQR) | 2.6% | 1.8% |
| Standard Deviation (Sample) | 1.8% | 1.8% |
| Standard Deviation (Population) | 1.8% | 1.8% |
Demographics Similar to Assyrians/Chaldeans/Syriacs and Venezuelans by Unemployment Among Ages 35 to 44 years
In terms of unemployment among ages 35 to 44 years, the demographic groups most similar to Assyrians/Chaldeans/Syriacs are Turkish (4.3%, a difference of 0.020%), Bulgarian (4.3%, a difference of 0.080%), Immigrants from Japan (4.3%, a difference of 0.080%), European (4.3%, a difference of 0.27%), and Tlingit-Haida (4.3%, a difference of 0.55%). Similarly, the demographic groups most similar to Venezuelans are Bolivian (4.1%, a difference of 0.040%), Sudanese (4.1%, a difference of 0.10%), Czech (4.1%, a difference of 0.14%), Immigrants from Singapore (4.1%, a difference of 0.17%), and Tongan (4.2%, a difference of 0.23%).
| Demographics | Rating | Rank | Unemployment Among Ages 35 to 44 years |
| Danes | 99.9 /100 | #9 | Exceptional 4.1% |
| Immigrants | Singapore | 99.9 /100 | #10 | Exceptional 4.1% |
| Sudanese | 99.9 /100 | #11 | Exceptional 4.1% |
| Venezuelans | 99.9 /100 | #12 | Exceptional 4.1% |
| Bolivians | 99.9 /100 | #13 | Exceptional 4.1% |
| Czechs | 99.9 /100 | #14 | Exceptional 4.1% |
| Tongans | 99.8 /100 | #15 | Exceptional 4.2% |
| Cubans | 99.8 /100 | #16 | Exceptional 4.2% |
| Swedes | 99.8 /100 | #17 | Exceptional 4.2% |
| Latvians | 99.8 /100 | #18 | Exceptional 4.2% |
| Immigrants | Nepal | 99.7 /100 | #19 | Exceptional 4.2% |
| Immigrants | Bolivia | 99.7 /100 | #20 | Exceptional 4.2% |
| Paraguayans | 99.6 /100 | #21 | Exceptional 4.2% |
| Scandinavians | 99.5 /100 | #22 | Exceptional 4.2% |
| Immigrants | Kuwait | 99.5 /100 | #23 | Exceptional 4.3% |
| Tlingit-Haida | 99.5 /100 | #24 | Exceptional 4.3% |
| Bulgarians | 99.3 /100 | #25 | Exceptional 4.3% |
| Turks | 99.3 /100 | #26 | Exceptional 4.3% |
| Assyrians/Chaldeans/Syriacs | 99.3 /100 | #27 | Exceptional 4.3% |
| Immigrants | Japan | 99.3 /100 | #28 | Exceptional 4.3% |
| Europeans | 99.2 /100 | #29 | Exceptional 4.3% |