Assyrian/Chaldean/Syriac vs South African Unemployment Among Women with Children Under 6 years

COMPARE

Assyrian/Chaldean/Syriac
Race
Ancestry
AfghanAfricanAlaska NativeAlaskan AthabascanAlbanianAleutAlsatianAmericanApacheArabArapahoArgentineanArmenianAssyrian/Chaldean/SyriacAustralianAustrianBahamianBangladeshiBarbadianBasqueBelgianBelizeanBermudanBhutaneseBlackfeetBolivianBrazilianBritishBritish West IndianBulgarianBurmeseCajunCambodianCanadianCape VerdeanCarpatho RusynCelticCentral AmericanCentral American IndianCherokeeCheyenneChickasawChileanChineseChippewaChoctawColombianColvilleComancheCosta RicanCreeCreekCroatianCrowCubanCypriotCzechCzechoslovakianDanishDelawareDominicanDutchDutch West IndianEastern EuropeanEcuadorianEgyptianEnglishEstonianEthiopianEuropeanFijianFilipinoFinnishFrenchFrench American IndianFrench CanadianGermanGerman RussianGhanaianGreekGuamanian/ChamorroGuatemalanGuyaneseHaitianHmongHonduranHopiHoumaHungarianIcelanderIndian (Asian)IndonesianInupiatIranianIraqiIrishIroquoisIsraeliItalianJamaicanJapaneseJordanianKenyanKiowaKoreanLaotianLatvianLebaneseLiberianLithuanianLumbeeLuxembourgerMacedonianMalaysianMalteseMarshalleseMenomineeMexicanMexican American IndianMongolianMoroccanNative HawaiianNavajoNepaleseNew ZealanderNicaraguanNigerianNorthern EuropeanNorwegianOkinawanOsageOttawaPaiutePakistaniPalestinianPanamanianParaguayanPennsylvania GermanPeruvianPimaPolishPortuguesePotawatomiPuebloPuerto RicanPuget Sound SalishRomanianRussianSalvadoranSamoanScandinavianScotch-IrishScottishSeminoleSenegaleseSerbianShoshoneSierra LeoneanSiouxSlavicSlovakSloveneSomaliSouth AmericanSouth American IndianSoviet UnionSpaniardSpanishSpanish AmericanSpanish American IndianSri LankanSubsaharan AfricanSudaneseSwedishSwissSyrianTaiwaneseThaiTlingit-HaidaTohono O'OdhamTonganTrinidadian and TobagonianTsimshianTurkishU.S. Virgin IslanderUgandanUkrainianUruguayanUteVenezuelanVietnameseWelshWest IndianYakamaYaquiYugoslavianYumanYup'ikZimbabwean
Immigration
NonimmigrantsImmigrantsAfghanistanAfricaAlbaniaArgentinaArmeniaAsiaAustraliaAustriaBahamasBangladeshBarbadosBelarusBelgiumBelizeBoliviaBosnia and HerzegovinaBrazilBulgariaBurma/MyanmarCabo VerdeCambodiaCameroonCanadaCaribbeanCentral AmericaChileChinaColombiaCongoCosta RicaCroatiaCubaCzechoslovakiaDenmarkDominicaDominican RepublicEastern AfricaEastern AsiaEastern EuropeEcuadorEgyptEl SalvadorEnglandEritreaEthiopiaEuropeFijiFranceGermanyGhanaGreeceGrenadaGuatemalaGuyanaHaitiHondurasHong KongHungaryIndiaIndonesiaIranIraqIrelandIsraelItalyJamaicaJapanJordanKazakhstanKenyaKoreaKuwaitLaosLatin AmericaLatviaLebanonLiberiaLithuaniaMalaysiaMexicoMicronesiaMiddle AfricaMoldovaMoroccoNepalNetherlandsNicaraguaNigeriaNorth AmericaNorth MacedoniaNorthern AfricaNorthern EuropeNorwayOceaniaPakistanPanamaPeruPhilippinesPolandPortugalRomaniaRussiaSaudi ArabiaScotlandSenegalSerbiaSierra LeoneSingaporeSomaliaSouth AfricaSouth AmericaSouth Central AsiaSouth Eastern AsiaSouthern EuropeSpainSri LankaSt. Vincent and the GrenadinesSudanSwedenSwitzerlandSyriaTaiwanThailandTrinidad and TobagoTurkeyUgandaUkraineUruguayUzbekistanVenezuelaVietnamWest IndiesWestern AfricaWestern AsiaWestern EuropeYemenZaireZimbabweAzores
South African
Race
Ancestry
AfghanAfricanAlaska NativeAlaskan AthabascanAlbanianAleutAlsatianAmericanApacheArabArapahoArgentineanArmenianAustralianAustrianBahamianBangladeshiBarbadianBasqueBelgianBelizeanBermudanBhutaneseBlackfeetBolivianBrazilianBritishBritish West IndianBulgarianBurmeseCajunCambodianCanadianCape VerdeanCarpatho RusynCelticCentral AmericanCentral American IndianCherokeeCheyenneChickasawChileanChineseChippewaChoctawColombianColvilleComancheCosta RicanCreeCreekCroatianCrowCubanCypriotCzechCzechoslovakianDanishDelawareDominicanDutchDutch West IndianEastern EuropeanEcuadorianEgyptianEnglishEstonianEthiopianEuropeanFijianFilipinoFinnishFrenchFrench American IndianFrench CanadianGermanGerman RussianGhanaianGreekGuamanian/ChamorroGuatemalanGuyaneseHaitianHmongHonduranHopiHoumaHungarianIcelanderIndian (Asian)IndonesianInupiatIranianIraqiIrishIroquoisIsraeliItalianJamaicanJapaneseJordanianKenyanKiowaKoreanLaotianLatvianLebaneseLiberianLithuanianLumbeeLuxembourgerMacedonianMalaysianMalteseMarshalleseMenomineeMexicanMexican American IndianMongolianMoroccanNative HawaiianNavajoNepaleseNew ZealanderNicaraguanNigerianNorthern EuropeanNorwegianOkinawanOsageOttawaPaiutePakistaniPalestinianPanamanianParaguayanPennsylvania GermanPeruvianPimaPolishPortuguesePotawatomiPuebloPuerto RicanPuget Sound SalishRomanianRussianSalvadoranSamoanScandinavianScotch-IrishScottishSeminoleSenegaleseSerbianShoshoneSierra LeoneanSiouxSlavicSlovakSloveneSomaliSouth AfricanSouth AmericanSouth American IndianSoviet UnionSpaniardSpanishSpanish AmericanSpanish American IndianSri LankanSubsaharan AfricanSudaneseSwedishSwissSyrianTaiwaneseThaiTlingit-HaidaTohono O'OdhamTonganTrinidadian and TobagonianTsimshianTurkishU.S. Virgin IslanderUgandanUkrainianUruguayanUteVenezuelanVietnameseWelshWest IndianYakamaYaquiYugoslavianYumanYup'ikZimbabwean
Immigration
NonimmigrantsImmigrantsAfghanistanAfricaAlbaniaArgentinaArmeniaAsiaAustraliaAustriaBahamasBangladeshBarbadosBelarusBelgiumBelizeBoliviaBosnia and HerzegovinaBrazilBulgariaBurma/MyanmarCabo VerdeCambodiaCameroonCanadaCaribbeanCentral AmericaChileChinaColombiaCongoCosta RicaCroatiaCubaCzechoslovakiaDenmarkDominicaDominican RepublicEastern AfricaEastern AsiaEastern EuropeEcuadorEgyptEl SalvadorEnglandEritreaEthiopiaEuropeFijiFranceGermanyGhanaGreeceGrenadaGuatemalaGuyanaHaitiHondurasHong KongHungaryIndiaIndonesiaIranIraqIrelandIsraelItalyJamaicaJapanJordanKazakhstanKenyaKoreaKuwaitLaosLatin AmericaLatviaLebanonLiberiaLithuaniaMalaysiaMexicoMicronesiaMiddle AfricaMoldovaMoroccoNepalNetherlandsNicaraguaNigeriaNorth AmericaNorth MacedoniaNorthern AfricaNorthern EuropeNorwayOceaniaPakistanPanamaPeruPhilippinesPolandPortugalRomaniaRussiaSaudi ArabiaScotlandSenegalSerbiaSierra LeoneSingaporeSomaliaSouth AfricaSouth AmericaSouth Central AsiaSouth Eastern AsiaSouthern EuropeSpainSri LankaSt. Vincent and the GrenadinesSudanSwedenSwitzerlandSyriaTaiwanThailandTrinidad and TobagoTurkeyUgandaUkraineUruguayUzbekistanVenezuelaVietnamWest IndiesWestern AfricaWestern AsiaWestern EuropeYemenZaireZimbabweAzores
Unemployment Among Women with Children Under 6 years
Income
Poverty
Unemployment
Labor Participation
Family Structure
Vehicle Availability
Education Level
Disability

Unemployment Among Women with Children Under 6 years Comparison

Assyrians/Chaldeans/Syriacs

South Africans

Exceptional
Exceptional
6.5%
UNEMPLOYMENT AMONG WOMEN WITH CHILDREN UNDER 6 YEARS
100.0/ 100
METRIC RATING
18th/ 347
METRIC RANK
7.3%
UNEMPLOYMENT AMONG WOMEN WITH CHILDREN UNDER 6 YEARS
94.1/ 100
METRIC RATING
119th/ 347
METRIC RANK

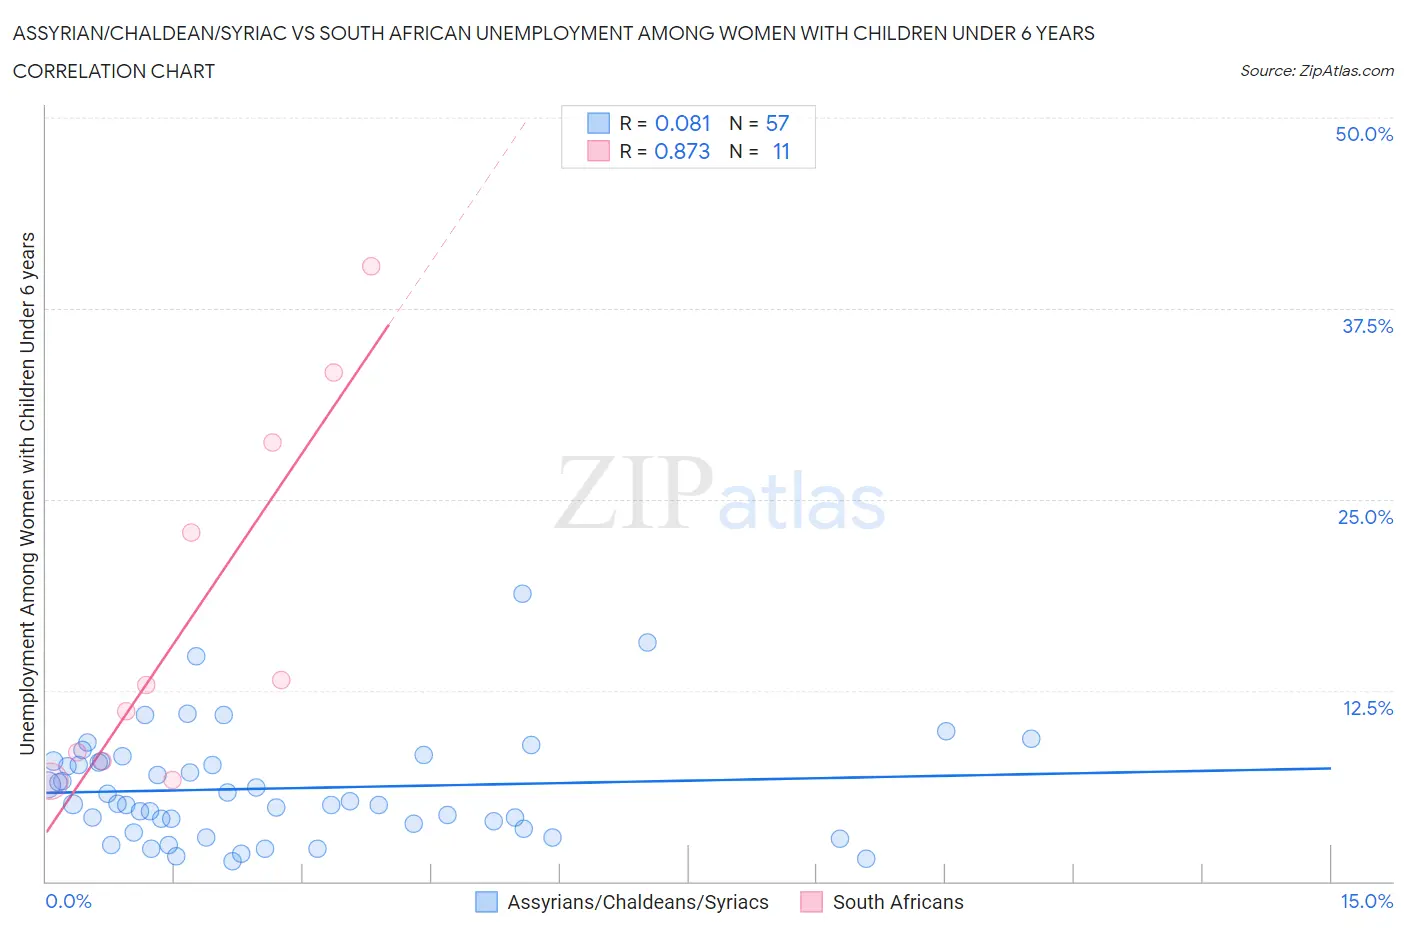
Assyrian/Chaldean/Syriac vs South African Unemployment Among Women with Children Under 6 years Correlation Chart

The statistical analysis conducted on geographies consisting of 98,335,487 people shows a slight positive correlation between the proportion of Assyrians/Chaldeans/Syriacs and unemployment rate among women with children under the age of 6 in the United States with a correlation coefficient (R) of 0.081 and weighted average of 6.5%. Similarly, the statistical analysis conducted on geographies consisting of 153,714,880 people shows a very strong positive correlation between the proportion of South Africans and unemployment rate among women with children under the age of 6 in the United States with a correlation coefficient (R) of 0.873 and weighted average of 7.3%, a difference of 13.0%.
Assyrian/Chaldean/Syriac vs South African Unemployment Among Women with Children Under 6 years

Unemployment Among Women with Children Under 6 years Correlation Summary

MeasurementAssyrian/Chaldean/SyriacSouth African
Minimum1.3%6.6%
Maximum18.8%40.3%
Range17.5%33.7%
Mean6.1%17.4%
Median5.1%12.8%
Interquartile 25% (IQ1)3.6%7.9%
Interquartile 75% (IQ3)7.9%28.7%
Interquartile Range (IQR)4.3%20.8%
Standard Deviation (Sample)3.6%11.9%
Standard Deviation (Population)3.5%11.3%

Similar Demographics by Unemployment Among Women with Children Under 6 years

Demographics Similar to Assyrians/Chaldeans/Syriacs by Unemployment Among Women with Children Under 6 years

In terms of unemployment among women with children under 6 years, the demographic groups most similar to Assyrians/Chaldeans/Syriacs are Mongolian (6.5%, a difference of 0.32%), Ute (6.5%, a difference of 0.38%), Burmese (6.5%, a difference of 0.43%), Immigrants from Korea (6.5%, a difference of 0.85%), and Immigrants from Malaysia (6.4%, a difference of 0.98%).
DemographicsRating | RankUnemployment Among Women with Children Under 6 years
Indians (Asian)
100.0
/100
|
#11
Exceptional
6.3%
Immigrants | Singapore
100.0
/100
|
#12
Exceptional
6.3%
Immigrants | Eastern Asia
100.0
/100
|
#13
Exceptional
6.3%
Immigrants | Bulgaria
100.0
/100
|
#14
Exceptional
6.3%
Thais
100.0
/100
|
#15
Exceptional
6.3%
Immigrants | Uzbekistan
100.0
/100
|
#16
Exceptional
6.3%
Immigrants | Malaysia
100.0
/100
|
#17
Exceptional
6.4%
Assyrians/Chaldeans/Syriacs
100.0
/100
|
#18
Exceptional
6.5%
Mongolians
100.0
/100
|
#19
Exceptional
6.5%
Ute
100.0
/100
|
#20
Exceptional
6.5%
Burmese
100.0
/100
|
#21
Exceptional
6.5%
Immigrants | Korea
100.0
/100
|
#22
Exceptional
6.5%
Bulgarians
100.0
/100
|
#23
Exceptional
6.5%
Laotians
100.0
/100
|
#24
Exceptional
6.5%
Soviet Union
100.0
/100
|
#25
Exceptional
6.5%

Demographics Similar to South Africans by Unemployment Among Women with Children Under 6 years

In terms of unemployment among women with children under 6 years, the demographic groups most similar to South Africans are Iraqi (7.3%, a difference of 0.070%), Serbian (7.3%, a difference of 0.11%), Immigrants from Chile (7.3%, a difference of 0.19%), Immigrants from Bosnia and Herzegovina (7.3%, a difference of 0.20%), and Immigrants from Zaire (7.3%, a difference of 0.25%).
DemographicsRating | RankUnemployment Among Women with Children Under 6 years
Israelis
96.5
/100
|
#112
Exceptional
7.2%
Nicaraguans
96.3
/100
|
#113
Exceptional
7.2%
Argentineans
96.2
/100
|
#114
Exceptional
7.2%
Immigrants | Italy
96.1
/100
|
#115
Exceptional
7.2%
Armenians
95.9
/100
|
#116
Exceptional
7.2%
Immigrants | Kenya
95.4
/100
|
#117
Exceptional
7.3%
Serbians
94.5
/100
|
#118
Exceptional
7.3%
South Africans
94.1
/100
|
#119
Exceptional
7.3%
Iraqis
93.9
/100
|
#120
Exceptional
7.3%
Immigrants | Chile
93.5
/100
|
#121
Exceptional
7.3%
Immigrants | Bosnia and Herzegovina
93.5
/100
|
#122
Exceptional
7.3%
Immigrants | Zaire
93.3
/100
|
#123
Exceptional
7.3%
Immigrants | South Africa
92.5
/100
|
#124
Exceptional
7.3%
Pakistanis
92.2
/100
|
#125
Exceptional
7.3%
Immigrants | Burma/Myanmar
91.9
/100
|
#126
Exceptional
7.3%