Argentinean vs Greek Unemployment Among Women with Children Under 6 years
COMPARE
Argentinean
Greek
Unemployment Among Women with Children Under 6 years
Unemployment Among Women with Children Under 6 years Comparison
Argentineans
Greeks
7.2%
UNEMPLOYMENT AMONG WOMEN WITH CHILDREN UNDER 6 YEARS
96.2/ 100
METRIC RATING
114th/ 347
METRIC RANK
7.4%
UNEMPLOYMENT AMONG WOMEN WITH CHILDREN UNDER 6 YEARS
82.6/ 100
METRIC RATING
141st/ 347
METRIC RANK
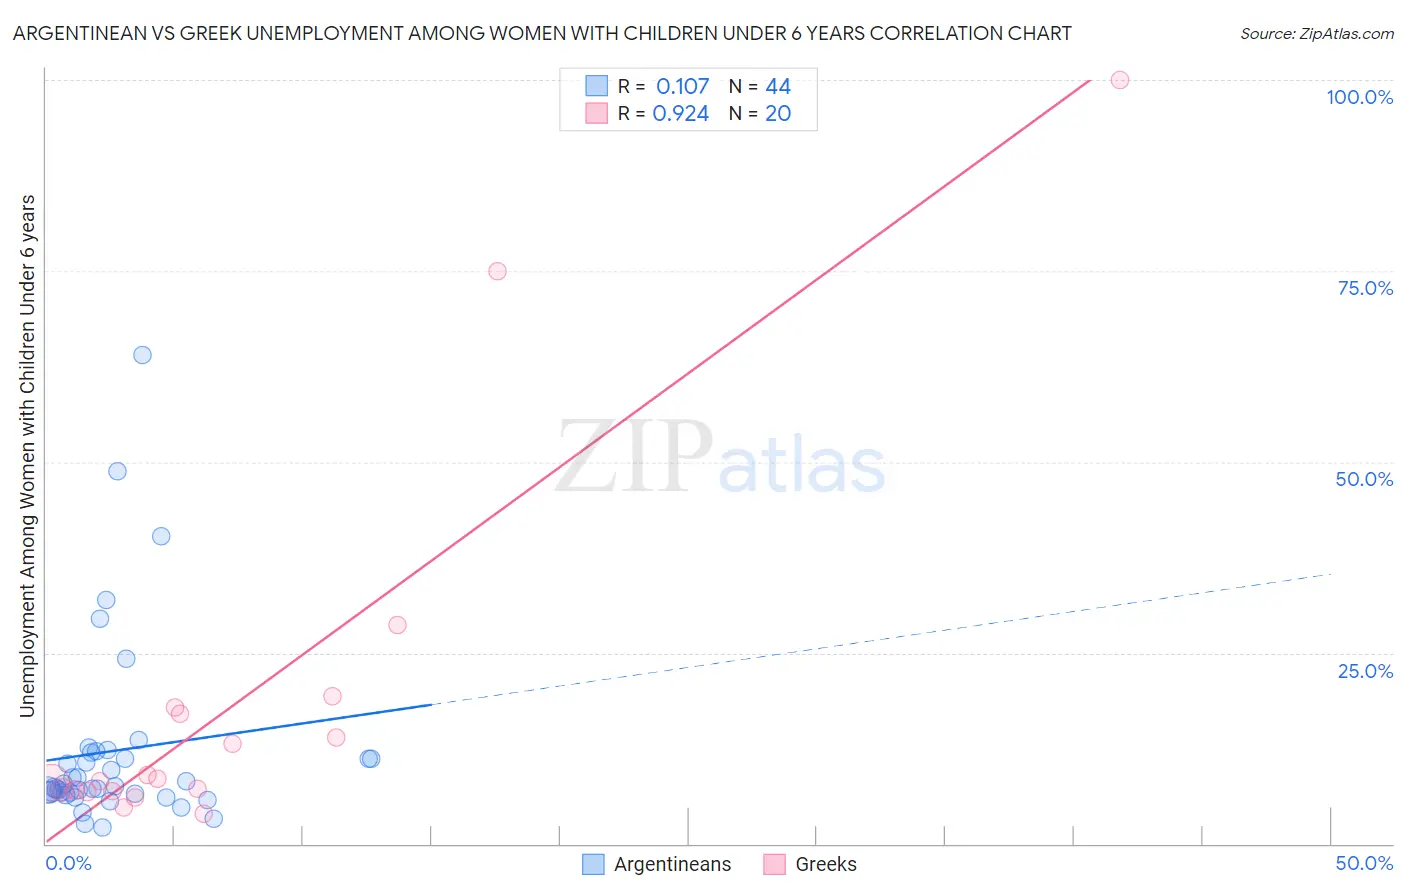
Argentinean vs Greek Unemployment Among Women with Children Under 6 years Correlation Chart
The statistical analysis conducted on geographies consisting of 240,769,726 people shows a poor positive correlation between the proportion of Argentineans and unemployment rate among women with children under the age of 6 in the United States with a correlation coefficient (R) of 0.107 and weighted average of 7.2%. Similarly, the statistical analysis conducted on geographies consisting of 343,398,128 people shows a near-perfect positive correlation between the proportion of Greeks and unemployment rate among women with children under the age of 6 in the United States with a correlation coefficient (R) of 0.924 and weighted average of 7.4%, a difference of 3.0%.
Unemployment Among Women with Children Under 6 years Correlation Summary
| Measurement | Argentinean | Greek |
| Minimum | 2.2% | 4.0% |
| Maximum | 64.0% | 100.0% |
| Range | 61.8% | 96.0% |
| Mean | 12.2% | 18.4% |
| Median | 7.4% | 8.4% |
| Interquartile 25% (IQ1) | 6.6% | 6.9% |
| Interquartile 75% (IQ3) | 11.6% | 17.4% |
| Interquartile Range (IQR) | 5.0% | 10.5% |
| Standard Deviation (Sample) | 12.4% | 24.7% |
| Standard Deviation (Population) | 12.3% | 24.1% |
Similar Demographics by Unemployment Among Women with Children Under 6 years
Demographics Similar to Argentineans by Unemployment Among Women with Children Under 6 years
In terms of unemployment among women with children under 6 years, the demographic groups most similar to Argentineans are Nicaraguan (7.2%, a difference of 0.040%), Immigrants from Italy (7.2%, a difference of 0.080%), Israeli (7.2%, a difference of 0.12%), Armenian (7.2%, a difference of 0.17%), and Norwegian (7.2%, a difference of 0.23%).
| Demographics | Rating | Rank | Unemployment Among Women with Children Under 6 years |
| Immigrants | Kazakhstan | 97.1 /100 | #107 | Exceptional 7.2% |
| Eastern Europeans | 96.9 /100 | #108 | Exceptional 7.2% |
| Australians | 96.9 /100 | #109 | Exceptional 7.2% |
| Palestinians | 96.8 /100 | #110 | Exceptional 7.2% |
| Norwegians | 96.7 /100 | #111 | Exceptional 7.2% |
| Israelis | 96.5 /100 | #112 | Exceptional 7.2% |
| Nicaraguans | 96.3 /100 | #113 | Exceptional 7.2% |
| Argentineans | 96.2 /100 | #114 | Exceptional 7.2% |
| Immigrants | Italy | 96.1 /100 | #115 | Exceptional 7.2% |
| Armenians | 95.9 /100 | #116 | Exceptional 7.2% |
| Immigrants | Kenya | 95.4 /100 | #117 | Exceptional 7.3% |
| Serbians | 94.5 /100 | #118 | Exceptional 7.3% |
| South Africans | 94.1 /100 | #119 | Exceptional 7.3% |
| Iraqis | 93.9 /100 | #120 | Exceptional 7.3% |
| Immigrants | Chile | 93.5 /100 | #121 | Exceptional 7.3% |
Demographics Similar to Greeks by Unemployment Among Women with Children Under 6 years
In terms of unemployment among women with children under 6 years, the demographic groups most similar to Greeks are Scandinavian (7.4%, a difference of 0.060%), Immigrants from Argentina (7.5%, a difference of 0.12%), Korean (7.5%, a difference of 0.14%), Immigrants from Colombia (7.4%, a difference of 0.16%), and Immigrants from Norway (7.4%, a difference of 0.18%).
| Demographics | Rating | Rank | Unemployment Among Women with Children Under 6 years |
| Immigrants | Bolivia | 85.7 /100 | #134 | Excellent 7.4% |
| Immigrants | Northern Africa | 85.3 /100 | #135 | Excellent 7.4% |
| Immigrants | Morocco | 84.9 /100 | #136 | Excellent 7.4% |
| Immigrants | Cambodia | 84.6 /100 | #137 | Excellent 7.4% |
| Immigrants | Norway | 84.1 /100 | #138 | Excellent 7.4% |
| Immigrants | Colombia | 83.9 /100 | #139 | Excellent 7.4% |
| Scandinavians | 83.0 /100 | #140 | Excellent 7.4% |
| Greeks | 82.6 /100 | #141 | Excellent 7.4% |
| Immigrants | Argentina | 81.5 /100 | #142 | Excellent 7.5% |
| Koreans | 81.3 /100 | #143 | Excellent 7.5% |
| Europeans | 79.1 /100 | #144 | Good 7.5% |
| Immigrants | Jordan | 78.9 /100 | #145 | Good 7.5% |
| Japanese | 78.9 /100 | #146 | Good 7.5% |
| Immigrants | Oceania | 78.4 /100 | #147 | Good 7.5% |
| Immigrants | Brazil | 77.3 /100 | #148 | Good 7.5% |