Argentinean vs Immigrants from Central America Unemployment Among Women with Children Under 6 years
COMPARE
Argentinean
Immigrants from Central America
Unemployment Among Women with Children Under 6 years
Unemployment Among Women with Children Under 6 years Comparison
Argentineans
Immigrants from Central America
7.2%
UNEMPLOYMENT AMONG WOMEN WITH CHILDREN UNDER 6 YEARS
96.2/ 100
METRIC RATING
114th/ 347
METRIC RANK
8.9%
UNEMPLOYMENT AMONG WOMEN WITH CHILDREN UNDER 6 YEARS
0.0/ 100
METRIC RATING
295th/ 347
METRIC RANK
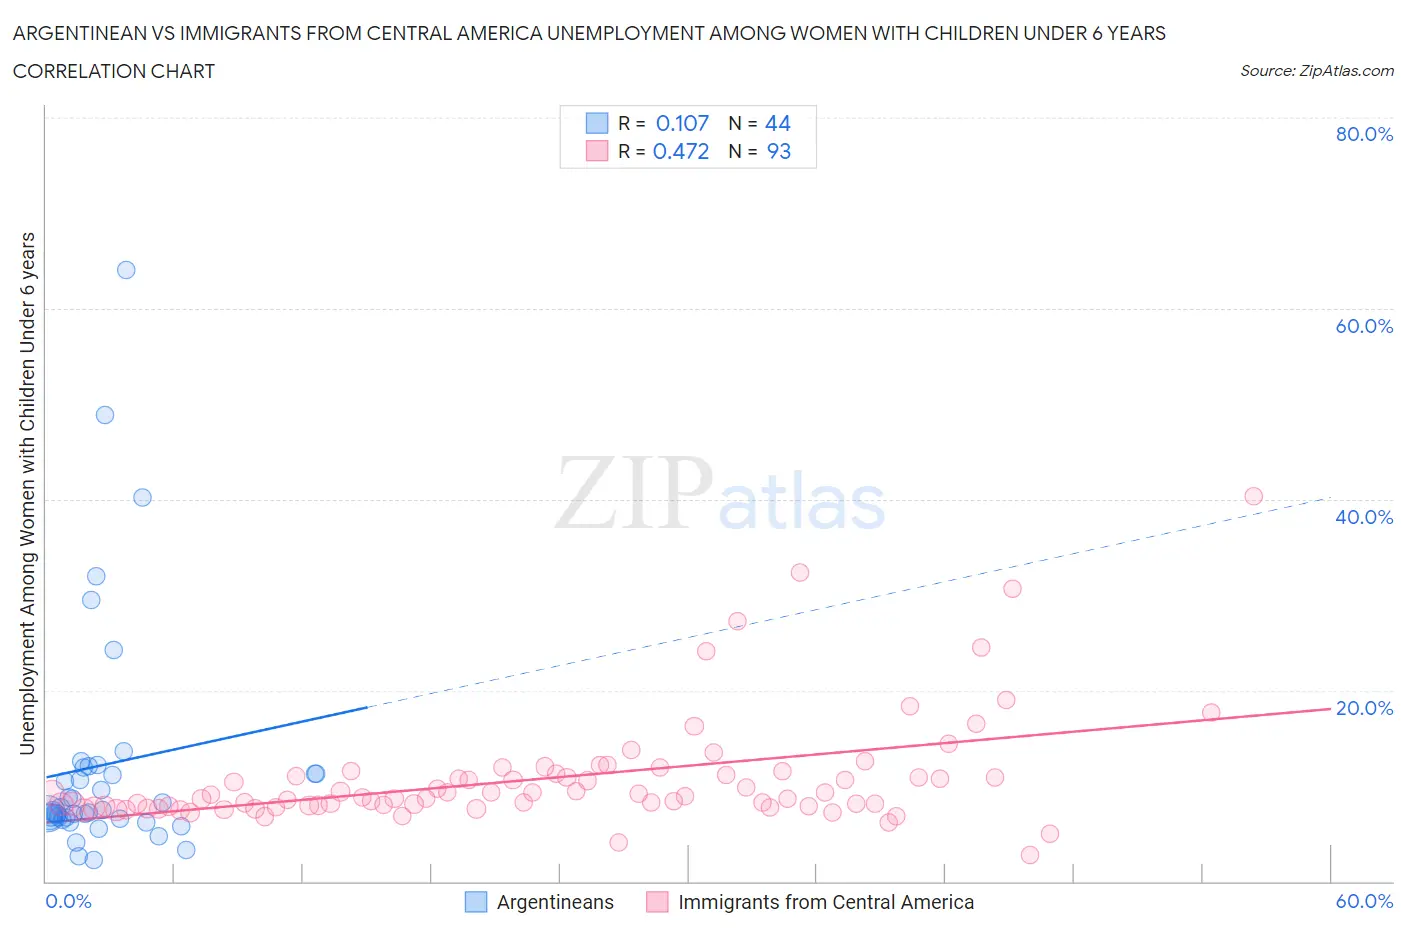
Argentinean vs Immigrants from Central America Unemployment Among Women with Children Under 6 years Correlation Chart
The statistical analysis conducted on geographies consisting of 240,769,726 people shows a poor positive correlation between the proportion of Argentineans and unemployment rate among women with children under the age of 6 in the United States with a correlation coefficient (R) of 0.107 and weighted average of 7.2%. Similarly, the statistical analysis conducted on geographies consisting of 368,932,426 people shows a moderate positive correlation between the proportion of Immigrants from Central America and unemployment rate among women with children under the age of 6 in the United States with a correlation coefficient (R) of 0.472 and weighted average of 8.9%, a difference of 22.4%.
Unemployment Among Women with Children Under 6 years Correlation Summary
| Measurement | Argentinean | Immigrants from Central America |
| Minimum | 2.2% | 2.7% |
| Maximum | 64.0% | 40.4% |
| Range | 61.8% | 37.7% |
| Mean | 12.2% | 10.8% |
| Median | 7.4% | 8.9% |
| Interquartile 25% (IQ1) | 6.6% | 7.8% |
| Interquartile 75% (IQ3) | 11.6% | 11.2% |
| Interquartile Range (IQR) | 5.0% | 3.4% |
| Standard Deviation (Sample) | 12.4% | 5.9% |
| Standard Deviation (Population) | 12.3% | 5.9% |
Similar Demographics by Unemployment Among Women with Children Under 6 years
Demographics Similar to Argentineans by Unemployment Among Women with Children Under 6 years
In terms of unemployment among women with children under 6 years, the demographic groups most similar to Argentineans are Nicaraguan (7.2%, a difference of 0.040%), Immigrants from Italy (7.2%, a difference of 0.080%), Israeli (7.2%, a difference of 0.12%), Armenian (7.2%, a difference of 0.17%), and Norwegian (7.2%, a difference of 0.23%).
| Demographics | Rating | Rank | Unemployment Among Women with Children Under 6 years |
| Immigrants | Kazakhstan | 97.1 /100 | #107 | Exceptional 7.2% |
| Eastern Europeans | 96.9 /100 | #108 | Exceptional 7.2% |
| Australians | 96.9 /100 | #109 | Exceptional 7.2% |
| Palestinians | 96.8 /100 | #110 | Exceptional 7.2% |
| Norwegians | 96.7 /100 | #111 | Exceptional 7.2% |
| Israelis | 96.5 /100 | #112 | Exceptional 7.2% |
| Nicaraguans | 96.3 /100 | #113 | Exceptional 7.2% |
| Argentineans | 96.2 /100 | #114 | Exceptional 7.2% |
| Immigrants | Italy | 96.1 /100 | #115 | Exceptional 7.2% |
| Armenians | 95.9 /100 | #116 | Exceptional 7.2% |
| Immigrants | Kenya | 95.4 /100 | #117 | Exceptional 7.3% |
| Serbians | 94.5 /100 | #118 | Exceptional 7.3% |
| South Africans | 94.1 /100 | #119 | Exceptional 7.3% |
| Iraqis | 93.9 /100 | #120 | Exceptional 7.3% |
| Immigrants | Chile | 93.5 /100 | #121 | Exceptional 7.3% |
Demographics Similar to Immigrants from Central America by Unemployment Among Women with Children Under 6 years
In terms of unemployment among women with children under 6 years, the demographic groups most similar to Immigrants from Central America are Nonimmigrants (8.8%, a difference of 0.050%), Immigrants from Dominican Republic (8.9%, a difference of 0.13%), Immigrants from Bangladesh (8.8%, a difference of 0.23%), Mexican (8.9%, a difference of 0.23%), and Tlingit-Haida (8.9%, a difference of 0.39%).
| Demographics | Rating | Rank | Unemployment Among Women with Children Under 6 years |
| Bahamians | 0.0 /100 | #288 | Tragic 8.7% |
| Iroquois | 0.0 /100 | #289 | Tragic 8.7% |
| Vietnamese | 0.0 /100 | #290 | Tragic 8.8% |
| Jamaicans | 0.0 /100 | #291 | Tragic 8.8% |
| Cheyenne | 0.0 /100 | #292 | Tragic 8.8% |
| Immigrants | Bangladesh | 0.0 /100 | #293 | Tragic 8.8% |
| Immigrants | Nonimmigrants | 0.0 /100 | #294 | Tragic 8.8% |
| Immigrants | Central America | 0.0 /100 | #295 | Tragic 8.9% |
| Immigrants | Dominican Republic | 0.0 /100 | #296 | Tragic 8.9% |
| Mexicans | 0.0 /100 | #297 | Tragic 8.9% |
| Tlingit-Haida | 0.0 /100 | #298 | Tragic 8.9% |
| Immigrants | Jamaica | 0.0 /100 | #299 | Tragic 8.9% |
| Creek | 0.0 /100 | #300 | Tragic 8.9% |
| Chickasaw | 0.0 /100 | #301 | Tragic 9.0% |
| Hispanics or Latinos | 0.0 /100 | #302 | Tragic 9.0% |