German Russian vs Pennsylvania German Unemployment Among Ages 60 to 64 years
COMPARE
German Russian
Pennsylvania German
Unemployment Among Ages 60 to 64 years
Unemployment Among Ages 60 to 64 years Comparison
German Russians
Pennsylvania Germans
4.9%
UNEMPLOYMENT AMONG AGES 60 TO 64 YEARS
16.8/ 100
METRIC RATING
208th/ 347
METRIC RANK
4.8%
UNEMPLOYMENT AMONG AGES 60 TO 64 YEARS
87.8/ 100
METRIC RATING
135th/ 347
METRIC RANK
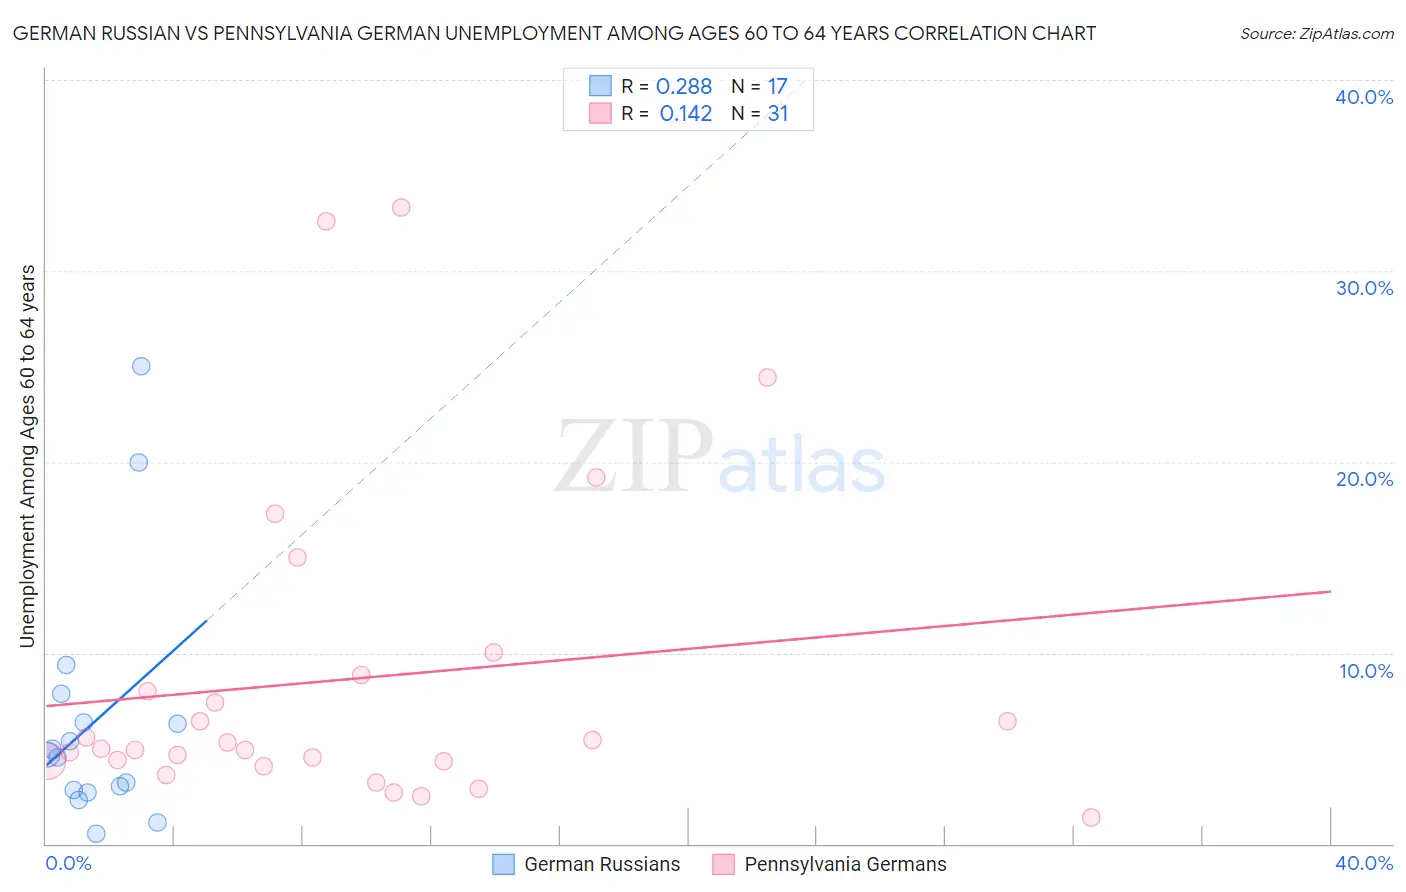
German Russian vs Pennsylvania German Unemployment Among Ages 60 to 64 years Correlation Chart
The statistical analysis conducted on geographies consisting of 92,139,052 people shows a weak positive correlation between the proportion of German Russians and unemployment rate among population between the ages 60 and 64 in the United States with a correlation coefficient (R) of 0.288 and weighted average of 4.9%. Similarly, the statistical analysis conducted on geographies consisting of 211,890,030 people shows a poor positive correlation between the proportion of Pennsylvania Germans and unemployment rate among population between the ages 60 and 64 in the United States with a correlation coefficient (R) of 0.142 and weighted average of 4.8%, a difference of 3.2%.
Unemployment Among Ages 60 to 64 years Correlation Summary
| Measurement | German Russian | Pennsylvania German |
| Minimum | 0.50% | 1.4% |
| Maximum | 25.0% | 33.3% |
| Range | 24.5% | 31.9% |
| Mean | 6.5% | 8.6% |
| Median | 4.6% | 5.0% |
| Interquartile 25% (IQ1) | 2.7% | 4.3% |
| Interquartile 75% (IQ3) | 7.1% | 8.8% |
| Interquartile Range (IQR) | 4.4% | 4.5% |
| Standard Deviation (Sample) | 6.5% | 8.3% |
| Standard Deviation (Population) | 6.3% | 8.2% |
Similar Demographics by Unemployment Among Ages 60 to 64 years
Demographics Similar to German Russians by Unemployment Among Ages 60 to 64 years
In terms of unemployment among ages 60 to 64 years, the demographic groups most similar to German Russians are Sierra Leonean (4.9%, a difference of 0.010%), Chippewa (4.9%, a difference of 0.030%), Immigrants from Indonesia (4.9%, a difference of 0.040%), New Zealander (4.9%, a difference of 0.040%), and Cherokee (4.9%, a difference of 0.040%).
| Demographics | Rating | Rank | Unemployment Among Ages 60 to 64 years |
| Colombians | 22.7 /100 | #201 | Fair 4.9% |
| Immigrants | Western Africa | 20.6 /100 | #202 | Fair 4.9% |
| Uruguayans | 19.9 /100 | #203 | Poor 4.9% |
| Russians | 18.9 /100 | #204 | Poor 4.9% |
| Immigrants | Indonesia | 17.4 /100 | #205 | Poor 4.9% |
| New Zealanders | 17.4 /100 | #206 | Poor 4.9% |
| Chippewa | 17.3 /100 | #207 | Poor 4.9% |
| German Russians | 16.8 /100 | #208 | Poor 4.9% |
| Sierra Leoneans | 16.5 /100 | #209 | Poor 4.9% |
| Cherokee | 16.1 /100 | #210 | Poor 4.9% |
| Blackfeet | 15.7 /100 | #211 | Poor 4.9% |
| Moroccans | 15.0 /100 | #212 | Poor 4.9% |
| Eastern Europeans | 14.3 /100 | #213 | Poor 4.9% |
| Immigrants | Russia | 13.7 /100 | #214 | Poor 4.9% |
| Immigrants | South Eastern Asia | 13.1 /100 | #215 | Poor 4.9% |
Demographics Similar to Pennsylvania Germans by Unemployment Among Ages 60 to 64 years
In terms of unemployment among ages 60 to 64 years, the demographic groups most similar to Pennsylvania Germans are French Canadian (4.8%, a difference of 0.010%), Cambodian (4.8%, a difference of 0.070%), Basque (4.8%, a difference of 0.090%), Immigrants from Lithuania (4.8%, a difference of 0.090%), and Immigrants from Africa (4.8%, a difference of 0.090%).
| Demographics | Rating | Rank | Unemployment Among Ages 60 to 64 years |
| Choctaw | 90.3 /100 | #128 | Exceptional 4.8% |
| Immigrants | Serbia | 90.2 /100 | #129 | Exceptional 4.8% |
| Immigrants | Syria | 90.1 /100 | #130 | Exceptional 4.8% |
| Immigrants | Lebanon | 89.6 /100 | #131 | Excellent 4.8% |
| Lithuanians | 89.6 /100 | #132 | Excellent 4.8% |
| Yaqui | 89.5 /100 | #133 | Excellent 4.8% |
| Basques | 88.8 /100 | #134 | Excellent 4.8% |
| Pennsylvania Germans | 87.8 /100 | #135 | Excellent 4.8% |
| French Canadians | 87.6 /100 | #136 | Excellent 4.8% |
| Cambodians | 86.9 /100 | #137 | Excellent 4.8% |
| Immigrants | Lithuania | 86.7 /100 | #138 | Excellent 4.8% |
| Immigrants | Africa | 86.6 /100 | #139 | Excellent 4.8% |
| Pima | 85.8 /100 | #140 | Excellent 4.8% |
| Panamanians | 85.5 /100 | #141 | Excellent 4.8% |
| Immigrants | Ethiopia | 85.3 /100 | #142 | Excellent 4.8% |