Apache vs Blackfeet 8th Grade
COMPARE
Apache
Blackfeet
8th Grade
8th Grade Comparison
Apache
Blackfeet
95.5%
8TH GRADE
19.4/ 100
METRIC RATING
202nd/ 347
METRIC RANK
96.0%
8TH GRADE
80.8/ 100
METRIC RATING
151st/ 347
METRIC RANK
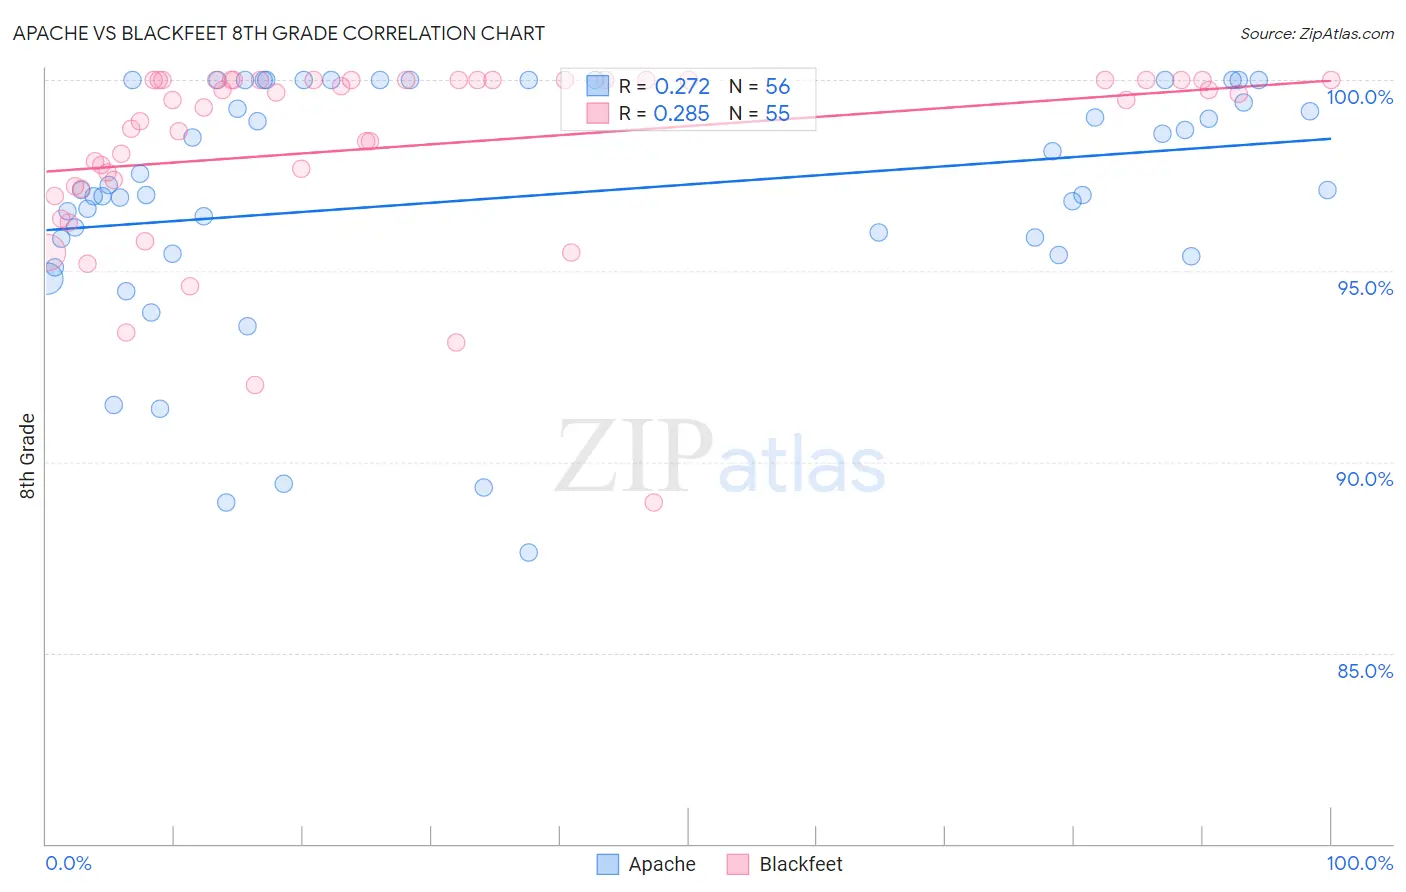
Apache vs Blackfeet 8th Grade Correlation Chart
The statistical analysis conducted on geographies consisting of 231,143,094 people shows a weak positive correlation between the proportion of Apache and percentage of population with at least 8th grade education in the United States with a correlation coefficient (R) of 0.272 and weighted average of 95.5%. Similarly, the statistical analysis conducted on geographies consisting of 309,580,893 people shows a weak positive correlation between the proportion of Blackfeet and percentage of population with at least 8th grade education in the United States with a correlation coefficient (R) of 0.285 and weighted average of 96.0%, a difference of 0.47%.
8th Grade Correlation Summary
| Measurement | Apache | Blackfeet |
| Minimum | 87.6% | 88.9% |
| Maximum | 100.0% | 100.0% |
| Range | 12.4% | 11.1% |
| Mean | 96.9% | 98.3% |
| Median | 97.1% | 99.5% |
| Interquartile 25% (IQ1) | 95.7% | 97.2% |
| Interquartile 75% (IQ3) | 100.0% | 100.0% |
| Interquartile Range (IQR) | 4.3% | 2.8% |
| Standard Deviation (Sample) | 3.2% | 2.4% |
| Standard Deviation (Population) | 3.1% | 2.4% |
Similar Demographics by 8th Grade
Demographics Similar to Apache by 8th Grade
In terms of 8th grade, the demographic groups most similar to Apache are Immigrants from Argentina (95.5%, a difference of 0.010%), Moroccan (95.5%, a difference of 0.020%), Paraguayan (95.5%, a difference of 0.030%), Immigrants from Northern Africa (95.5%, a difference of 0.030%), and Argentinean (95.5%, a difference of 0.030%).
| Demographics | Rating | Rank | 8th Grade |
| Immigrants | Zaire | 25.2 /100 | #195 | Fair 95.6% |
| Assyrians/Chaldeans/Syriacs | 24.5 /100 | #196 | Fair 95.6% |
| Sierra Leoneans | 24.3 /100 | #197 | Fair 95.6% |
| Paraguayans | 22.6 /100 | #198 | Fair 95.5% |
| Immigrants | Northern Africa | 22.5 /100 | #199 | Fair 95.5% |
| Argentineans | 22.2 /100 | #200 | Fair 95.5% |
| Immigrants | Argentina | 20.6 /100 | #201 | Fair 95.5% |
| Apache | 19.4 /100 | #202 | Poor 95.5% |
| Moroccans | 17.4 /100 | #203 | Poor 95.5% |
| Hawaiians | 16.7 /100 | #204 | Poor 95.5% |
| Immigrants | Bahamas | 16.7 /100 | #205 | Poor 95.5% |
| Comanche | 16.3 /100 | #206 | Poor 95.5% |
| Immigrants | Sudan | 15.1 /100 | #207 | Poor 95.5% |
| Portuguese | 14.3 /100 | #208 | Poor 95.5% |
| Immigrants | Lebanon | 13.7 /100 | #209 | Poor 95.4% |
Demographics Similar to Blackfeet by 8th Grade
In terms of 8th grade, the demographic groups most similar to Blackfeet are Immigrants from Russia (96.0%, a difference of 0.0%), French American Indian (96.0%, a difference of 0.0%), Immigrants from Israel (96.0%, a difference of 0.010%), Immigrants from Jordan (95.9%, a difference of 0.010%), and Hopi (95.9%, a difference of 0.010%).
| Demographics | Rating | Rank | 8th Grade |
| Immigrants | Belarus | 84.8 /100 | #144 | Excellent 96.0% |
| Lumbee | 84.1 /100 | #145 | Excellent 96.0% |
| Israelis | 84.1 /100 | #146 | Excellent 96.0% |
| Colville | 84.0 /100 | #147 | Excellent 96.0% |
| Albanians | 83.1 /100 | #148 | Excellent 96.0% |
| Immigrants | Israel | 81.3 /100 | #149 | Excellent 96.0% |
| Immigrants | Russia | 80.9 /100 | #150 | Excellent 96.0% |
| Blackfeet | 80.8 /100 | #151 | Excellent 96.0% |
| French American Indians | 80.6 /100 | #152 | Excellent 96.0% |
| Immigrants | Jordan | 79.5 /100 | #153 | Good 95.9% |
| Hopi | 79.4 /100 | #154 | Good 95.9% |
| Kenyans | 74.5 /100 | #155 | Good 95.9% |
| Ugandans | 74.1 /100 | #156 | Good 95.9% |
| Immigrants | Taiwan | 70.5 /100 | #157 | Good 95.9% |
| Arabs | 69.4 /100 | #158 | Good 95.9% |