Immigrants from North Macedonia vs Yugoslavian Unemployment Among Seniors over 75 years
COMPARE
Immigrants from North Macedonia
Yugoslavian
Unemployment Among Seniors over 75 years
Unemployment Among Seniors over 75 years Comparison
Immigrants from North Macedonia
Yugoslavians
11.3%
UNEMPLOYMENT AMONG SENIORS OVER 75 YEARS
0.0/ 100
METRIC RATING
336th/ 347
METRIC RANK
9.1%
UNEMPLOYMENT AMONG SENIORS OVER 75 YEARS
4.8/ 100
METRIC RATING
233rd/ 347
METRIC RANK
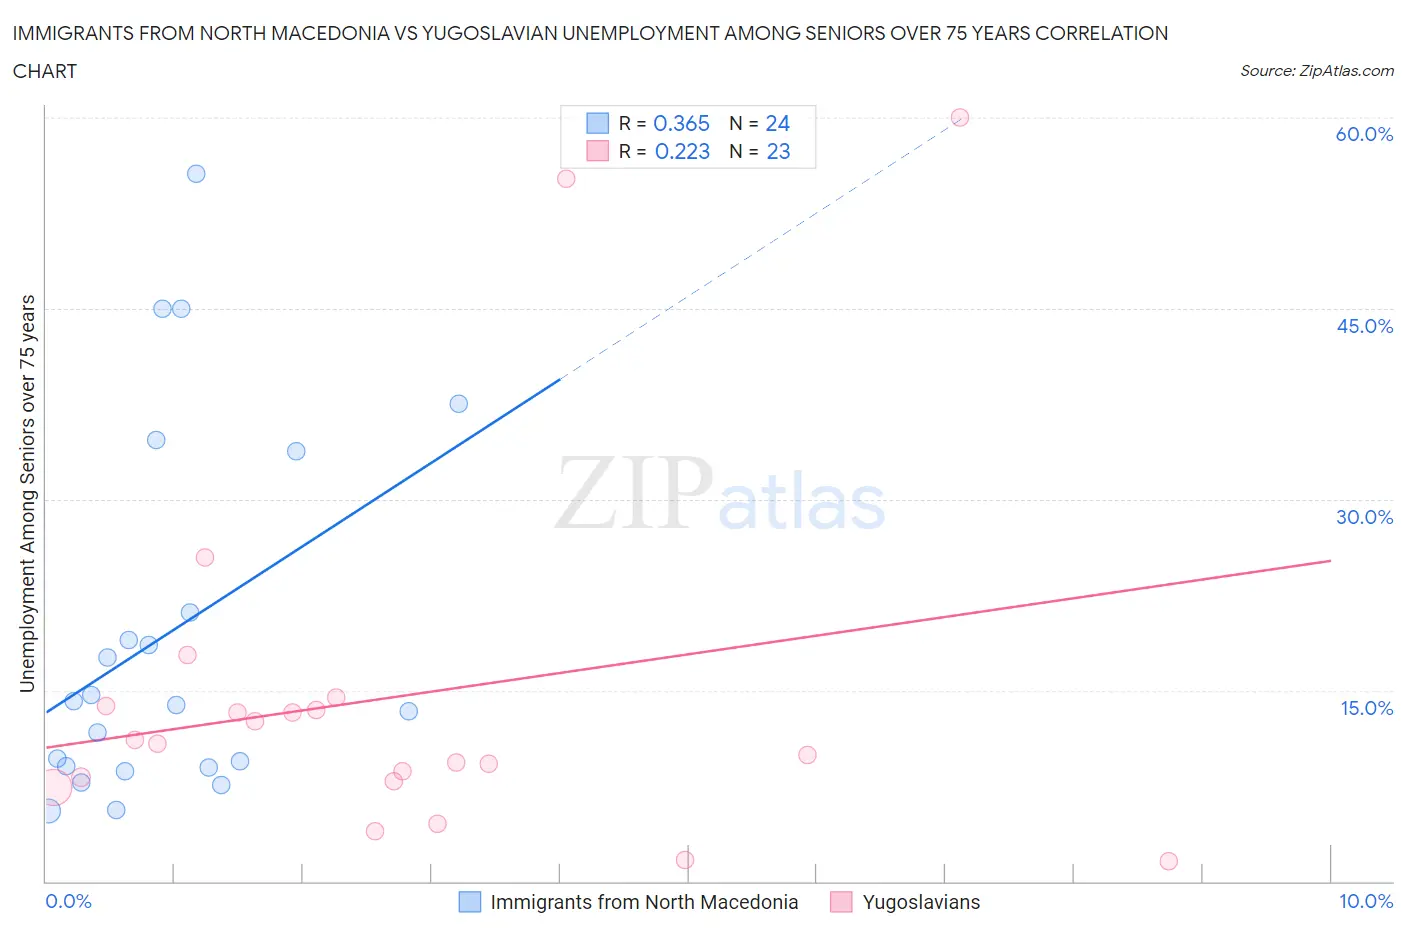
Immigrants from North Macedonia vs Yugoslavian Unemployment Among Seniors over 75 years Correlation Chart
The statistical analysis conducted on geographies consisting of 57,197,573 people shows a mild positive correlation between the proportion of Immigrants from North Macedonia and unemployment rate among seniors over the age of 75 in the United States with a correlation coefficient (R) of 0.365 and weighted average of 11.3%. Similarly, the statistical analysis conducted on geographies consisting of 163,293,100 people shows a weak positive correlation between the proportion of Yugoslavians and unemployment rate among seniors over the age of 75 in the United States with a correlation coefficient (R) of 0.223 and weighted average of 9.1%, a difference of 24.3%.
Unemployment Among Seniors over 75 years Correlation Summary
| Measurement | Immigrants from North Macedonia | Yugoslavian |
| Minimum | 5.5% | 1.6% |
| Maximum | 55.6% | 60.0% |
| Range | 50.1% | 58.4% |
| Mean | 19.5% | 14.5% |
| Median | 13.9% | 10.8% |
| Interquartile 25% (IQ1) | 9.0% | 7.8% |
| Interquartile 75% (IQ3) | 27.4% | 13.8% |
| Interquartile Range (IQR) | 18.4% | 5.9% |
| Standard Deviation (Sample) | 14.4% | 14.6% |
| Standard Deviation (Population) | 14.1% | 14.3% |
Similar Demographics by Unemployment Among Seniors over 75 years
Demographics Similar to Immigrants from North Macedonia by Unemployment Among Seniors over 75 years
In terms of unemployment among seniors over 75 years, the demographic groups most similar to Immigrants from North Macedonia are Cape Verdean (11.4%, a difference of 0.89%), French Canadian (11.2%, a difference of 1.2%), Assyrian/Chaldean/Syriac (11.1%, a difference of 2.3%), Alaskan Athabascan (11.0%, a difference of 2.7%), and Immigrants from Liberia (10.9%, a difference of 3.9%).
| Demographics | Rating | Rank | Unemployment Among Seniors over 75 years |
| Tsimshian | 0.0 /100 | #329 | Tragic 10.5% |
| Immigrants | Azores | 0.0 /100 | #330 | Tragic 10.7% |
| Tohono O'odham | 0.0 /100 | #331 | Tragic 10.8% |
| Immigrants | Liberia | 0.0 /100 | #332 | Tragic 10.9% |
| Alaskan Athabascans | 0.0 /100 | #333 | Tragic 11.0% |
| Assyrians/Chaldeans/Syriacs | 0.0 /100 | #334 | Tragic 11.1% |
| French Canadians | 0.0 /100 | #335 | Tragic 11.2% |
| Immigrants | North Macedonia | 0.0 /100 | #336 | Tragic 11.3% |
| Cape Verdeans | 0.0 /100 | #337 | Tragic 11.4% |
| Immigrants | Cabo Verde | 0.0 /100 | #338 | Tragic 12.3% |
| Cajuns | 0.0 /100 | #339 | Tragic 12.5% |
| Yup'ik | 0.0 /100 | #340 | Tragic 12.8% |
| Lumbee | 0.0 /100 | #341 | Tragic 13.5% |
| Hmong | 0.0 /100 | #342 | Tragic 13.7% |
| Alaska Natives | 0.0 /100 | #343 | Tragic 14.7% |
Demographics Similar to Yugoslavians by Unemployment Among Seniors over 75 years
In terms of unemployment among seniors over 75 years, the demographic groups most similar to Yugoslavians are African (9.1%, a difference of 0.020%), Northern European (9.1%, a difference of 0.040%), Immigrants from Central America (9.1%, a difference of 0.040%), Hispanic or Latino (9.1%, a difference of 0.050%), and Vietnamese (9.1%, a difference of 0.050%).
| Demographics | Rating | Rank | Unemployment Among Seniors over 75 years |
| Immigrants | Bangladesh | 5.9 /100 | #226 | Tragic 9.1% |
| Samoans | 5.7 /100 | #227 | Tragic 9.1% |
| Kenyans | 5.4 /100 | #228 | Tragic 9.1% |
| Hispanics or Latinos | 5.0 /100 | #229 | Tragic 9.1% |
| Northern Europeans | 4.9 /100 | #230 | Tragic 9.1% |
| Immigrants | Central America | 4.9 /100 | #231 | Tragic 9.1% |
| Africans | 4.9 /100 | #232 | Tragic 9.1% |
| Yugoslavians | 4.8 /100 | #233 | Tragic 9.1% |
| Vietnamese | 4.6 /100 | #234 | Tragic 9.1% |
| Panamanians | 4.0 /100 | #235 | Tragic 9.1% |
| Jordanians | 4.0 /100 | #236 | Tragic 9.1% |
| Houma | 3.9 /100 | #237 | Tragic 9.1% |
| Inupiat | 3.6 /100 | #238 | Tragic 9.1% |
| Mexicans | 3.5 /100 | #239 | Tragic 9.1% |
| Spanish | 3.3 /100 | #240 | Tragic 9.1% |