Aleut vs Puerto Rican Unemployment Among Ages 16 to 19 years
COMPARE
Aleut
Puerto Rican
Unemployment Among Ages 16 to 19 years
Unemployment Among Ages 16 to 19 years Comparison
Aleuts
Puerto Ricans
21.2%
UNEMPLOYMENT AMONG AGES 16 TO 19 YEARS
0.0/ 100
METRIC RATING
304th/ 347
METRIC RANK
27.5%
UNEMPLOYMENT AMONG AGES 16 TO 19 YEARS
0.0/ 100
METRIC RATING
341st/ 347
METRIC RANK
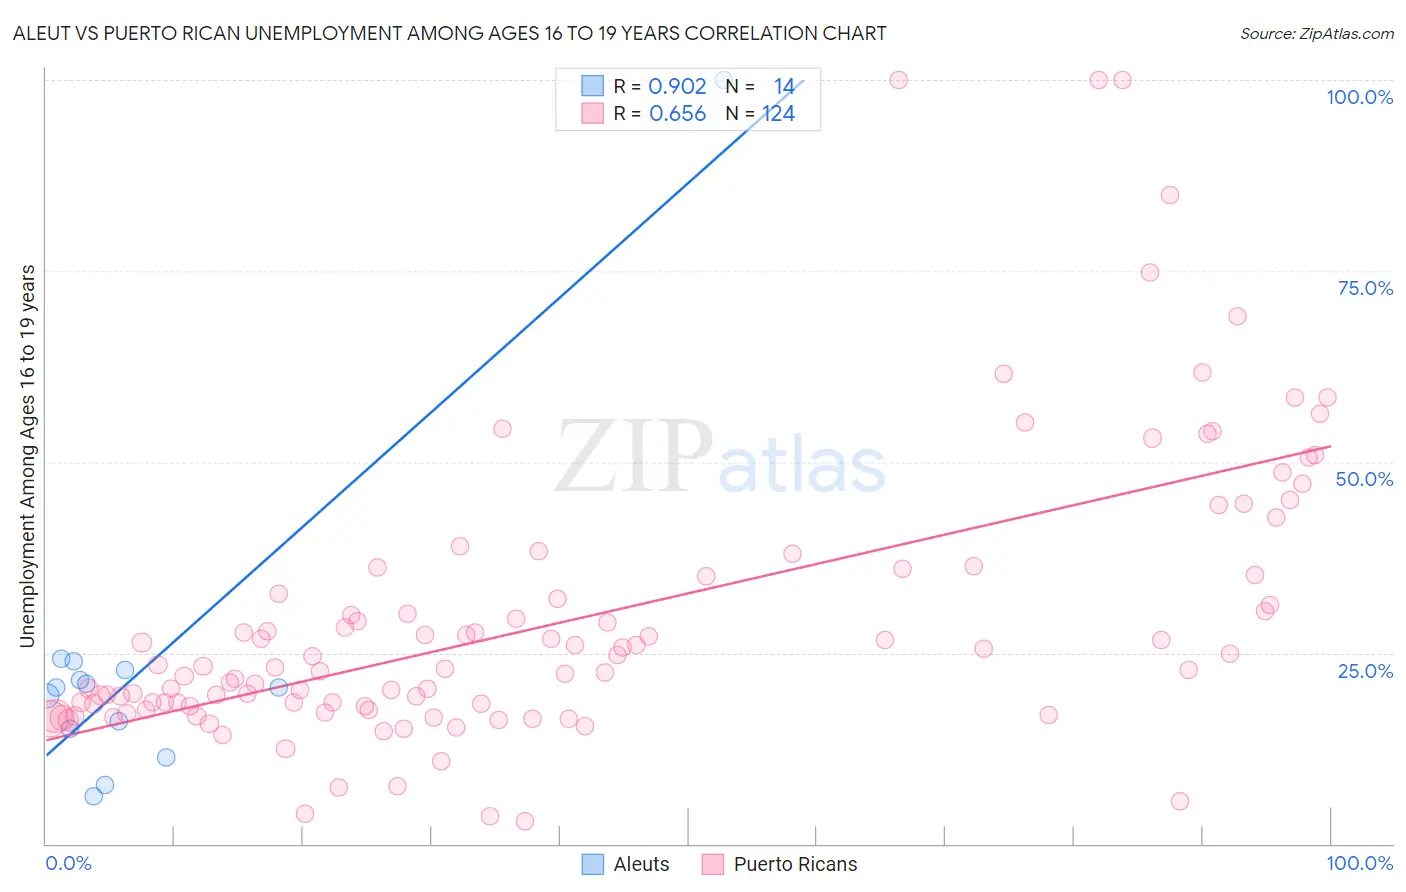
Aleut vs Puerto Rican Unemployment Among Ages 16 to 19 years Correlation Chart
The statistical analysis conducted on geographies consisting of 60,781,388 people shows a near-perfect positive correlation between the proportion of Aleuts and unemployment rate among population between the ages 16 and 19 in the United States with a correlation coefficient (R) of 0.902 and weighted average of 21.2%. Similarly, the statistical analysis conducted on geographies consisting of 485,554,515 people shows a significant positive correlation between the proportion of Puerto Ricans and unemployment rate among population between the ages 16 and 19 in the United States with a correlation coefficient (R) of 0.656 and weighted average of 27.5%, a difference of 30.0%.
Unemployment Among Ages 16 to 19 years Correlation Summary
| Measurement | Aleut | Puerto Rican |
| Minimum | 6.2% | 2.9% |
| Maximum | 100.0% | 100.0% |
| Range | 93.8% | 97.1% |
| Mean | 23.6% | 29.4% |
| Median | 20.4% | 23.1% |
| Interquartile 25% (IQ1) | 15.1% | 18.0% |
| Interquartile 75% (IQ3) | 22.8% | 35.1% |
| Interquartile Range (IQR) | 7.7% | 17.1% |
| Standard Deviation (Sample) | 22.7% | 18.8% |
| Standard Deviation (Population) | 21.9% | 18.7% |
Similar Demographics by Unemployment Among Ages 16 to 19 years
Demographics Similar to Aleuts by Unemployment Among Ages 16 to 19 years
In terms of unemployment among ages 16 to 19 years, the demographic groups most similar to Aleuts are Immigrants from Senegal (21.2%, a difference of 0.16%), U.S. Virgin Islander (21.3%, a difference of 0.56%), Senegalese (21.0%, a difference of 0.86%), Black/African American (21.4%, a difference of 1.1%), and Immigrants from Caribbean (20.9%, a difference of 1.2%).
| Demographics | Rating | Rank | Unemployment Among Ages 16 to 19 years |
| Alsatians | 0.0 /100 | #297 | Tragic 20.5% |
| Haitians | 0.0 /100 | #298 | Tragic 20.5% |
| Immigrants | Uzbekistan | 0.0 /100 | #299 | Tragic 20.5% |
| Ecuadorians | 0.0 /100 | #300 | Tragic 20.5% |
| Immigrants | Ecuador | 0.0 /100 | #301 | Tragic 20.9% |
| Immigrants | Caribbean | 0.0 /100 | #302 | Tragic 20.9% |
| Senegalese | 0.0 /100 | #303 | Tragic 21.0% |
| Aleuts | 0.0 /100 | #304 | Tragic 21.2% |
| Immigrants | Senegal | 0.0 /100 | #305 | Tragic 21.2% |
| U.S. Virgin Islanders | 0.0 /100 | #306 | Tragic 21.3% |
| Blacks/African Americans | 0.0 /100 | #307 | Tragic 21.4% |
| Immigrants | Bangladesh | 0.0 /100 | #308 | Tragic 21.5% |
| Natives/Alaskans | 0.0 /100 | #309 | Tragic 21.5% |
| Vietnamese | 0.0 /100 | #310 | Tragic 21.5% |
| Belizeans | 0.0 /100 | #311 | Tragic 21.6% |
Demographics Similar to Puerto Ricans by Unemployment Among Ages 16 to 19 years
In terms of unemployment among ages 16 to 19 years, the demographic groups most similar to Puerto Ricans are Inupiat (28.1%, a difference of 2.0%), Crow (26.2%, a difference of 4.8%), Navajo (29.0%, a difference of 5.6%), Immigrants from Grenada (25.7%, a difference of 6.8%), and Immigrants from St. Vincent and the Grenadines (25.7%, a difference of 7.0%).
| Demographics | Rating | Rank | Unemployment Among Ages 16 to 19 years |
| Paiute | 0.0 /100 | #333 | Tragic 24.4% |
| Guyanese | 0.0 /100 | #334 | Tragic 24.8% |
| Arapaho | 0.0 /100 | #335 | Tragic 25.2% |
| Kiowa | 0.0 /100 | #336 | Tragic 25.2% |
| Immigrants | Guyana | 0.0 /100 | #337 | Tragic 25.5% |
| Immigrants | St. Vincent and the Grenadines | 0.0 /100 | #338 | Tragic 25.7% |
| Immigrants | Grenada | 0.0 /100 | #339 | Tragic 25.7% |
| Crow | 0.0 /100 | #340 | Tragic 26.2% |
| Puerto Ricans | 0.0 /100 | #341 | Tragic 27.5% |
| Inupiat | 0.0 /100 | #342 | Tragic 28.1% |
| Navajo | 0.0 /100 | #343 | Tragic 29.0% |
| Colville | 0.0 /100 | #344 | Tragic 29.7% |
| Hopi | 0.0 /100 | #345 | Tragic 30.7% |
| Yuman | 0.0 /100 | #346 | Tragic 37.4% |
| Yup'ik | 0.0 /100 | #347 | Tragic 41.0% |