Sierra Leonean vs Puerto Rican Unemployment Among Ages 16 to 19 years
COMPARE
Sierra Leonean
Puerto Rican
Unemployment Among Ages 16 to 19 years
Unemployment Among Ages 16 to 19 years Comparison
Sierra Leoneans
Puerto Ricans
19.7%
UNEMPLOYMENT AMONG AGES 16 TO 19 YEARS
0.0/ 100
METRIC RATING
284th/ 347
METRIC RANK
27.5%
UNEMPLOYMENT AMONG AGES 16 TO 19 YEARS
0.0/ 100
METRIC RATING
341st/ 347
METRIC RANK
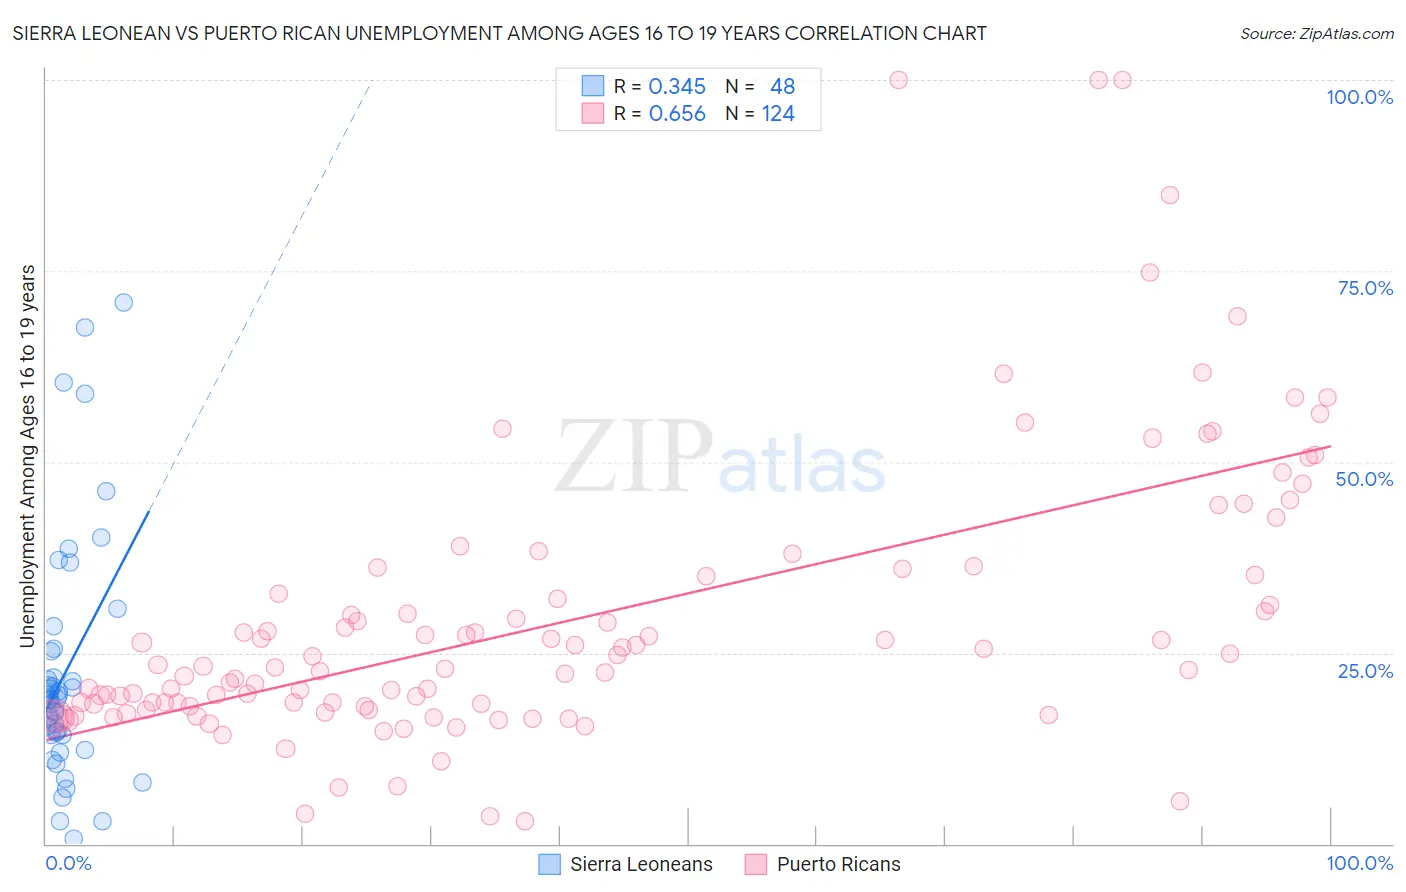
Sierra Leonean vs Puerto Rican Unemployment Among Ages 16 to 19 years Correlation Chart
The statistical analysis conducted on geographies consisting of 82,596,645 people shows a mild positive correlation between the proportion of Sierra Leoneans and unemployment rate among population between the ages 16 and 19 in the United States with a correlation coefficient (R) of 0.345 and weighted average of 19.7%. Similarly, the statistical analysis conducted on geographies consisting of 485,554,515 people shows a significant positive correlation between the proportion of Puerto Ricans and unemployment rate among population between the ages 16 and 19 in the United States with a correlation coefficient (R) of 0.656 and weighted average of 27.5%, a difference of 39.4%.
Unemployment Among Ages 16 to 19 years Correlation Summary
| Measurement | Sierra Leonean | Puerto Rican |
| Minimum | 0.60% | 2.9% |
| Maximum | 70.8% | 100.0% |
| Range | 70.2% | 97.1% |
| Mean | 22.6% | 29.4% |
| Median | 18.9% | 23.1% |
| Interquartile 25% (IQ1) | 14.3% | 18.0% |
| Interquartile 75% (IQ3) | 25.3% | 35.1% |
| Interquartile Range (IQR) | 11.1% | 17.1% |
| Standard Deviation (Sample) | 16.0% | 18.8% |
| Standard Deviation (Population) | 15.8% | 18.7% |
Similar Demographics by Unemployment Among Ages 16 to 19 years
Demographics Similar to Sierra Leoneans by Unemployment Among Ages 16 to 19 years
In terms of unemployment among ages 16 to 19 years, the demographic groups most similar to Sierra Leoneans are Sioux (19.7%, a difference of 0.010%), Dutch West Indian (19.7%, a difference of 0.060%), Ghanaian (19.8%, a difference of 0.18%), Bahamian (19.8%, a difference of 0.30%), and Immigrants from Ghana (19.8%, a difference of 0.37%).
| Demographics | Rating | Rank | Unemployment Among Ages 16 to 19 years |
| Immigrants | Western Africa | 0.0 /100 | #277 | Tragic 19.4% |
| Africans | 0.0 /100 | #278 | Tragic 19.5% |
| Ute | 0.0 /100 | #279 | Tragic 19.6% |
| Cajuns | 0.0 /100 | #280 | Tragic 19.6% |
| Cypriots | 0.0 /100 | #281 | Tragic 19.6% |
| Dutch West Indians | 0.0 /100 | #282 | Tragic 19.7% |
| Sioux | 0.0 /100 | #283 | Tragic 19.7% |
| Sierra Leoneans | 0.0 /100 | #284 | Tragic 19.7% |
| Ghanaians | 0.0 /100 | #285 | Tragic 19.8% |
| Bahamians | 0.0 /100 | #286 | Tragic 19.8% |
| Immigrants | Ghana | 0.0 /100 | #287 | Tragic 19.8% |
| Immigrants | Azores | 0.0 /100 | #288 | Tragic 19.8% |
| Pueblo | 0.0 /100 | #289 | Tragic 19.8% |
| Immigrants | Sierra Leone | 0.0 /100 | #290 | Tragic 20.0% |
| Immigrants | Yemen | 0.0 /100 | #291 | Tragic 20.0% |
Demographics Similar to Puerto Ricans by Unemployment Among Ages 16 to 19 years
In terms of unemployment among ages 16 to 19 years, the demographic groups most similar to Puerto Ricans are Inupiat (28.1%, a difference of 2.0%), Crow (26.2%, a difference of 4.8%), Navajo (29.0%, a difference of 5.6%), Immigrants from Grenada (25.7%, a difference of 6.8%), and Immigrants from St. Vincent and the Grenadines (25.7%, a difference of 7.0%).
| Demographics | Rating | Rank | Unemployment Among Ages 16 to 19 years |
| Paiute | 0.0 /100 | #333 | Tragic 24.4% |
| Guyanese | 0.0 /100 | #334 | Tragic 24.8% |
| Arapaho | 0.0 /100 | #335 | Tragic 25.2% |
| Kiowa | 0.0 /100 | #336 | Tragic 25.2% |
| Immigrants | Guyana | 0.0 /100 | #337 | Tragic 25.5% |
| Immigrants | St. Vincent and the Grenadines | 0.0 /100 | #338 | Tragic 25.7% |
| Immigrants | Grenada | 0.0 /100 | #339 | Tragic 25.7% |
| Crow | 0.0 /100 | #340 | Tragic 26.2% |
| Puerto Ricans | 0.0 /100 | #341 | Tragic 27.5% |
| Inupiat | 0.0 /100 | #342 | Tragic 28.1% |
| Navajo | 0.0 /100 | #343 | Tragic 29.0% |
| Colville | 0.0 /100 | #344 | Tragic 29.7% |
| Hopi | 0.0 /100 | #345 | Tragic 30.7% |
| Yuman | 0.0 /100 | #346 | Tragic 37.4% |
| Yup'ik | 0.0 /100 | #347 | Tragic 41.0% |