Albanian vs Immigrants from Eastern Europe Unemployment Among Ages 65 to 74 years
COMPARE
Albanian
Immigrants from Eastern Europe
Unemployment Among Ages 65 to 74 years
Unemployment Among Ages 65 to 74 years Comparison
Albanians
Immigrants from Eastern Europe
5.4%
UNEMPLOYMENT AMONG AGES 65 TO 74 YEARS
17.8/ 100
METRIC RATING
198th/ 347
METRIC RANK
5.3%
UNEMPLOYMENT AMONG AGES 65 TO 74 YEARS
71.5/ 100
METRIC RATING
157th/ 347
METRIC RANK
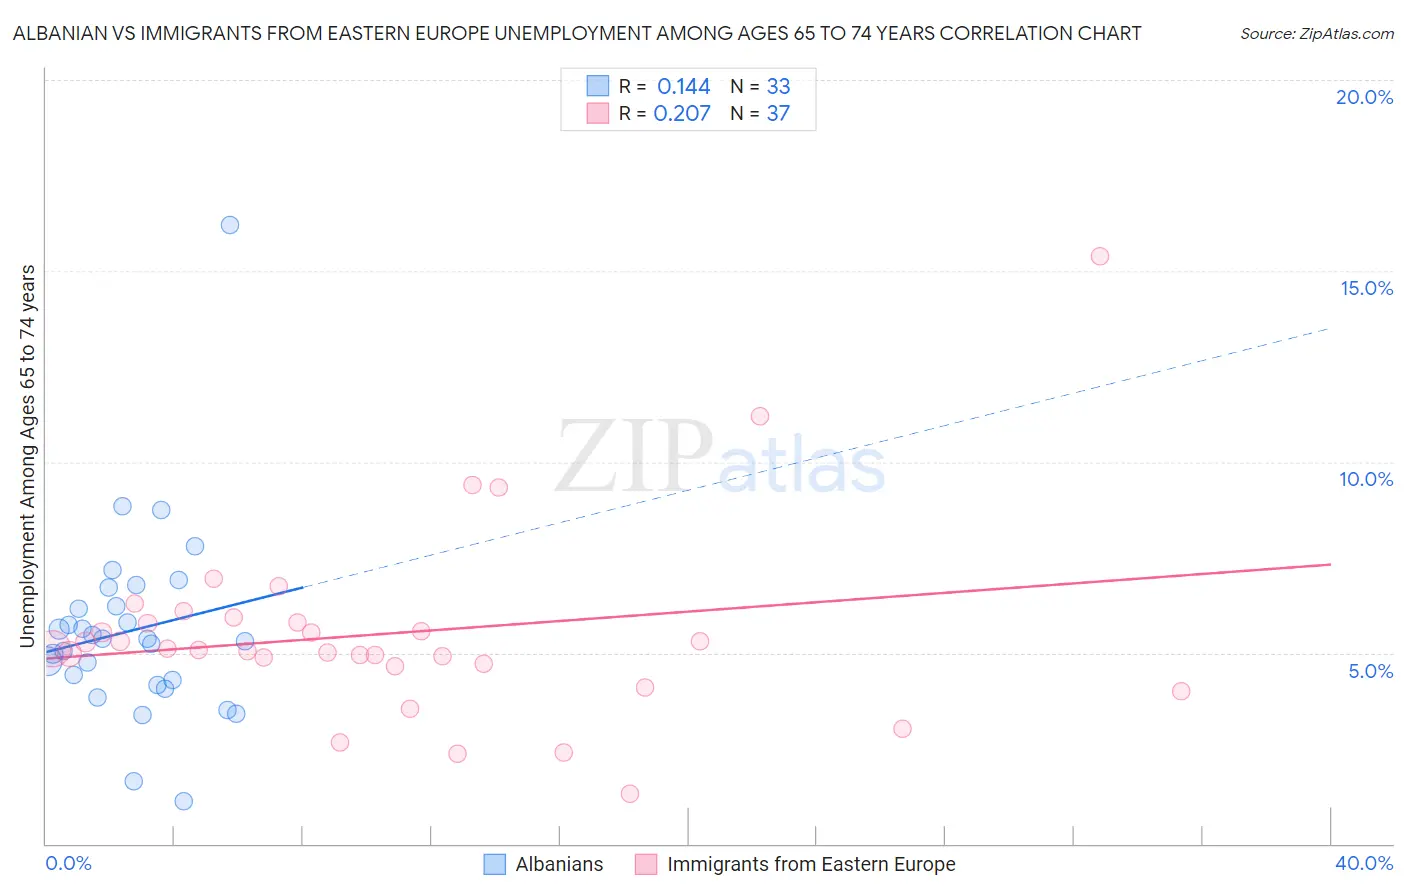
Albanian vs Immigrants from Eastern Europe Unemployment Among Ages 65 to 74 years Correlation Chart
The statistical analysis conducted on geographies consisting of 179,712,843 people shows a poor positive correlation between the proportion of Albanians and unemployment rate among population between the ages 65 and 74 in the United States with a correlation coefficient (R) of 0.144 and weighted average of 5.4%. Similarly, the statistical analysis conducted on geographies consisting of 403,873,095 people shows a weak positive correlation between the proportion of Immigrants from Eastern Europe and unemployment rate among population between the ages 65 and 74 in the United States with a correlation coefficient (R) of 0.207 and weighted average of 5.3%, a difference of 2.1%.
Unemployment Among Ages 65 to 74 years Correlation Summary
| Measurement | Albanian | Immigrants from Eastern Europe |
| Minimum | 1.1% | 1.3% |
| Maximum | 16.2% | 15.4% |
| Range | 15.1% | 14.1% |
| Mean | 5.6% | 5.5% |
| Median | 5.4% | 5.1% |
| Interquartile 25% (IQ1) | 4.2% | 4.7% |
| Interquartile 75% (IQ3) | 6.5% | 5.9% |
| Interquartile Range (IQR) | 2.2% | 1.2% |
| Standard Deviation (Sample) | 2.6% | 2.5% |
| Standard Deviation (Population) | 2.5% | 2.5% |
Similar Demographics by Unemployment Among Ages 65 to 74 years
Demographics Similar to Albanians by Unemployment Among Ages 65 to 74 years
In terms of unemployment among ages 65 to 74 years, the demographic groups most similar to Albanians are Immigrants from Belgium (5.4%, a difference of 0.10%), Colville (5.4%, a difference of 0.14%), Immigrants from Pakistan (5.4%, a difference of 0.16%), Costa Rican (5.4%, a difference of 0.17%), and Immigrants from Western Asia (5.4%, a difference of 0.18%).
| Demographics | Rating | Rank | Unemployment Among Ages 65 to 74 years |
| Immigrants | Egypt | 26.5 /100 | #191 | Fair 5.4% |
| Maltese | 26.4 /100 | #192 | Fair 5.4% |
| Cherokee | 25.8 /100 | #193 | Fair 5.4% |
| Immigrants | Denmark | 24.7 /100 | #194 | Fair 5.4% |
| Immigrants | China | 24.2 /100 | #195 | Fair 5.4% |
| Costa Ricans | 21.1 /100 | #196 | Fair 5.4% |
| Colville | 20.4 /100 | #197 | Fair 5.4% |
| Albanians | 17.8 /100 | #198 | Poor 5.4% |
| Immigrants | Belgium | 16.2 /100 | #199 | Poor 5.4% |
| Immigrants | Pakistan | 15.2 /100 | #200 | Poor 5.4% |
| Immigrants | Western Asia | 14.9 /100 | #201 | Poor 5.4% |
| Sub-Saharan Africans | 14.4 /100 | #202 | Poor 5.4% |
| Argentineans | 14.3 /100 | #203 | Poor 5.4% |
| Seminole | 14.3 /100 | #204 | Poor 5.4% |
| Icelanders | 14.2 /100 | #205 | Poor 5.4% |
Demographics Similar to Immigrants from Eastern Europe by Unemployment Among Ages 65 to 74 years
In terms of unemployment among ages 65 to 74 years, the demographic groups most similar to Immigrants from Eastern Europe are Immigrants from Cameroon (5.3%, a difference of 0.020%), Dutch (5.3%, a difference of 0.020%), Immigrants from France (5.3%, a difference of 0.020%), Immigrants from Cabo Verde (5.3%, a difference of 0.040%), and Polish (5.3%, a difference of 0.040%).
| Demographics | Rating | Rank | Unemployment Among Ages 65 to 74 years |
| Immigrants | Poland | 73.2 /100 | #150 | Good 5.3% |
| Immigrants | Indonesia | 72.9 /100 | #151 | Good 5.3% |
| Spanish | 72.6 /100 | #152 | Good 5.3% |
| Immigrants | Cabo Verde | 72.5 /100 | #153 | Good 5.3% |
| Poles | 72.4 /100 | #154 | Good 5.3% |
| Immigrants | Cameroon | 72.1 /100 | #155 | Good 5.3% |
| Dutch | 72.0 /100 | #156 | Good 5.3% |
| Immigrants | Eastern Europe | 71.5 /100 | #157 | Good 5.3% |
| Immigrants | France | 71.0 /100 | #158 | Good 5.3% |
| Immigrants | Czechoslovakia | 66.3 /100 | #159 | Good 5.3% |
| Bangladeshis | 65.8 /100 | #160 | Good 5.3% |
| Immigrants | Italy | 63.7 /100 | #161 | Good 5.3% |
| Immigrants | Eastern Asia | 62.5 /100 | #162 | Good 5.3% |
| Mongolians | 62.3 /100 | #163 | Good 5.3% |
| Immigrants | Philippines | 61.2 /100 | #164 | Good 5.3% |