Alaskan Athabascan vs Zimbabwean Unemployment Among Ages 65 to 74 years
COMPARE
Alaskan Athabascan
Zimbabwean
Unemployment Among Ages 65 to 74 years
Unemployment Among Ages 65 to 74 years Comparison
Alaskan Athabascans
Zimbabweans
7.4%
UNEMPLOYMENT AMONG AGES 65 TO 74 YEARS
0.0/ 100
METRIC RATING
343rd/ 347
METRIC RANK
5.9%
UNEMPLOYMENT AMONG AGES 65 TO 74 YEARS
0.0/ 100
METRIC RATING
318th/ 347
METRIC RANK
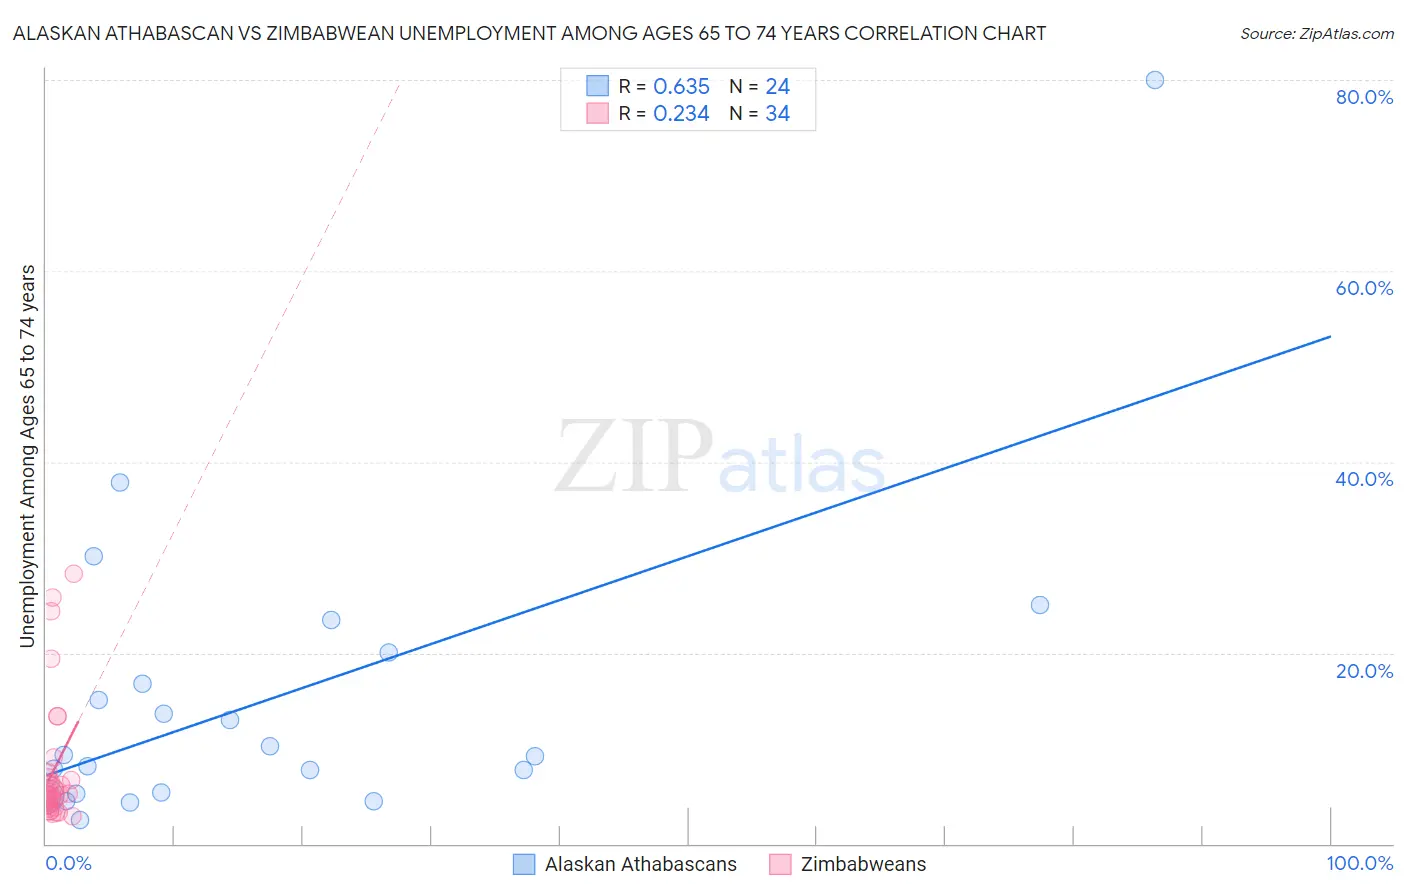
Alaskan Athabascan vs Zimbabwean Unemployment Among Ages 65 to 74 years Correlation Chart
The statistical analysis conducted on geographies consisting of 43,758,538 people shows a significant positive correlation between the proportion of Alaskan Athabascans and unemployment rate among population between the ages 65 and 74 in the United States with a correlation coefficient (R) of 0.635 and weighted average of 7.4%. Similarly, the statistical analysis conducted on geographies consisting of 67,414,209 people shows a weak positive correlation between the proportion of Zimbabweans and unemployment rate among population between the ages 65 and 74 in the United States with a correlation coefficient (R) of 0.234 and weighted average of 5.9%, a difference of 23.7%.
Unemployment Among Ages 65 to 74 years Correlation Summary
| Measurement | Alaskan Athabascan | Zimbabwean |
| Minimum | 2.5% | 2.9% |
| Maximum | 80.0% | 28.3% |
| Range | 77.5% | 25.4% |
| Mean | 15.3% | 7.8% |
| Median | 9.2% | 5.2% |
| Interquartile 25% (IQ1) | 5.3% | 4.0% |
| Interquartile 75% (IQ3) | 18.4% | 6.9% |
| Interquartile Range (IQR) | 13.0% | 2.9% |
| Standard Deviation (Sample) | 16.5% | 6.7% |
| Standard Deviation (Population) | 16.1% | 6.6% |
Similar Demographics by Unemployment Among Ages 65 to 74 years
Demographics Similar to Alaskan Athabascans by Unemployment Among Ages 65 to 74 years
In terms of unemployment among ages 65 to 74 years, the demographic groups most similar to Alaskan Athabascans are Inupiat (7.5%, a difference of 1.9%), Navajo (6.9%, a difference of 6.2%), Alaska Native (6.8%, a difference of 7.7%), Pima (6.6%, a difference of 11.2%), and Yakama (6.6%, a difference of 12.1%).
| Demographics | Rating | Rank | Unemployment Among Ages 65 to 74 years |
| Paiute | 0.0 /100 | #333 | Tragic 6.3% |
| Taiwanese | 0.0 /100 | #334 | Tragic 6.3% |
| Puerto Ricans | 0.0 /100 | #335 | Tragic 6.4% |
| Immigrants | Armenia | 0.0 /100 | #336 | Tragic 6.5% |
| Ute | 0.0 /100 | #337 | Tragic 6.5% |
| Tlingit-Haida | 0.0 /100 | #338 | Tragic 6.5% |
| Yakama | 0.0 /100 | #339 | Tragic 6.6% |
| Pima | 0.0 /100 | #340 | Tragic 6.6% |
| Alaska Natives | 0.0 /100 | #341 | Tragic 6.8% |
| Navajo | 0.0 /100 | #342 | Tragic 6.9% |
| Alaskan Athabascans | 0.0 /100 | #343 | Tragic 7.4% |
| Inupiat | 0.0 /100 | #344 | Tragic 7.5% |
| Immigrants | Yemen | 0.0 /100 | #345 | Tragic 8.3% |
| Yup'ik | 0.0 /100 | #346 | Tragic 9.5% |
| Crow | 0.0 /100 | #347 | Tragic 17.4% |
Demographics Similar to Zimbabweans by Unemployment Among Ages 65 to 74 years
In terms of unemployment among ages 65 to 74 years, the demographic groups most similar to Zimbabweans are Aleut (5.9%, a difference of 0.020%), Immigrants from Bahamas (5.9%, a difference of 0.11%), Immigrants from Central America (5.9%, a difference of 0.27%), Immigrants from Dominica (6.0%, a difference of 0.49%), and Immigrants from Mexico (6.0%, a difference of 0.71%).
| Demographics | Rating | Rank | Unemployment Among Ages 65 to 74 years |
| Venezuelans | 0.0 /100 | #311 | Tragic 5.9% |
| Hispanics or Latinos | 0.0 /100 | #312 | Tragic 5.9% |
| Vietnamese | 0.0 /100 | #313 | Tragic 5.9% |
| Immigrants | Venezuela | 0.0 /100 | #314 | Tragic 5.9% |
| Immigrants | Guatemala | 0.0 /100 | #315 | Tragic 5.9% |
| Immigrants | El Salvador | 0.0 /100 | #316 | Tragic 5.9% |
| Immigrants | Central America | 0.0 /100 | #317 | Tragic 5.9% |
| Zimbabweans | 0.0 /100 | #318 | Tragic 5.9% |
| Aleuts | 0.0 /100 | #319 | Tragic 5.9% |
| Immigrants | Bahamas | 0.0 /100 | #320 | Tragic 5.9% |
| Immigrants | Dominica | 0.0 /100 | #321 | Tragic 6.0% |
| Immigrants | Mexico | 0.0 /100 | #322 | Tragic 6.0% |
| Delaware | 0.0 /100 | #323 | Tragic 6.0% |
| Tohono O'odham | 0.0 /100 | #324 | Tragic 6.0% |
| Immigrants | Portugal | 0.0 /100 | #325 | Tragic 6.0% |