Belizean vs Spanish American Unemployment Among Seniors over 75 years
COMPARE
Belizean
Spanish American
Unemployment Among Seniors over 75 years
Unemployment Among Seniors over 75 years Comparison
Belizeans
Spanish Americans
8.4%
UNEMPLOYMENT AMONG SENIORS OVER 75 YEARS
96.3/ 100
METRIC RATING
126th/ 347
METRIC RANK
8.0%
UNEMPLOYMENT AMONG SENIORS OVER 75 YEARS
99.8/ 100
METRIC RATING
74th/ 347
METRIC RANK
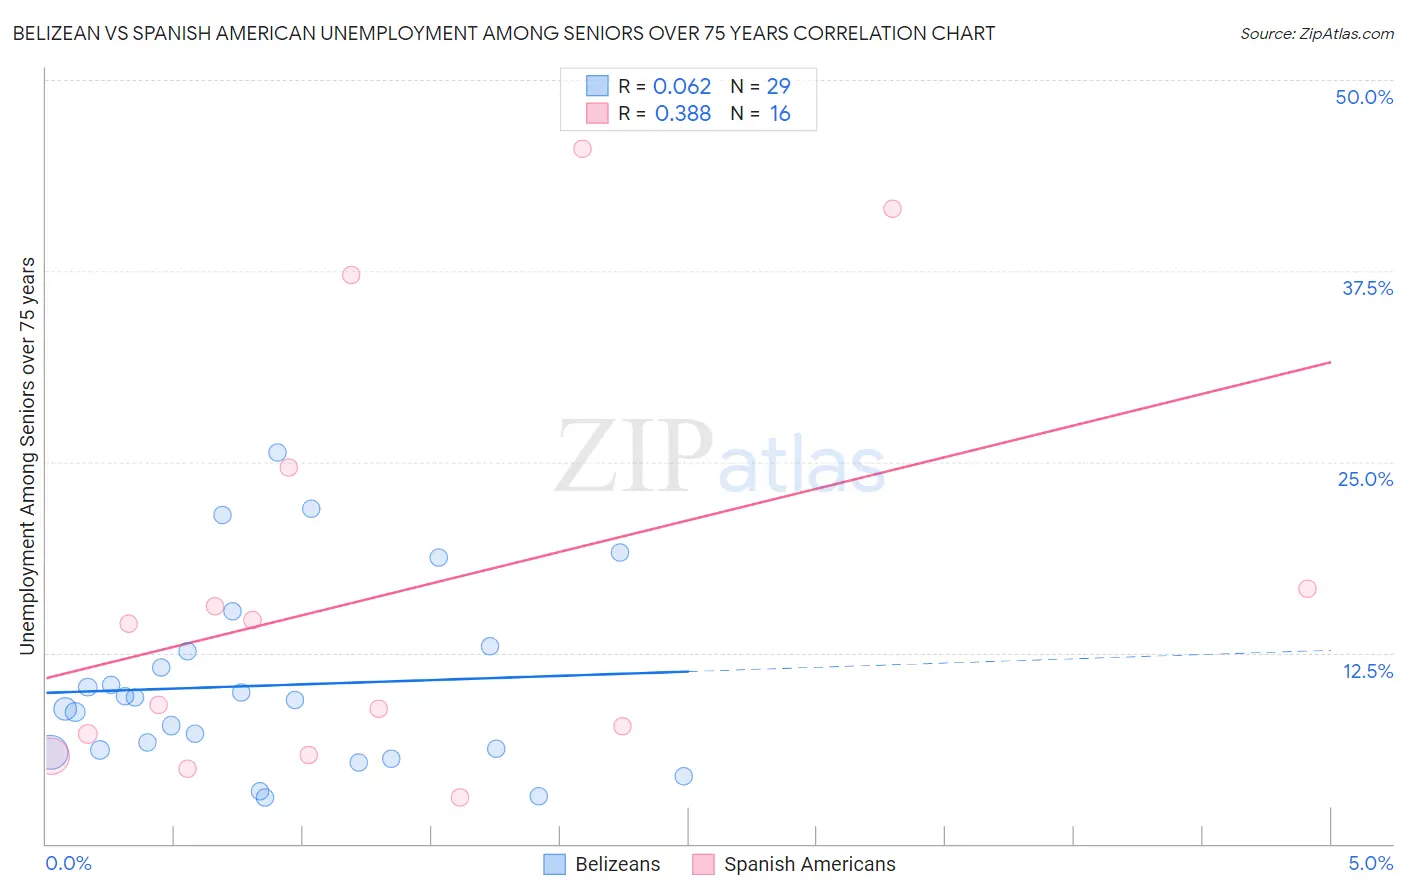
Belizean vs Spanish American Unemployment Among Seniors over 75 years Correlation Chart
The statistical analysis conducted on geographies consisting of 103,352,649 people shows a slight positive correlation between the proportion of Belizeans and unemployment rate among seniors over the age of 75 in the United States with a correlation coefficient (R) of 0.062 and weighted average of 8.4%. Similarly, the statistical analysis conducted on geographies consisting of 78,121,441 people shows a mild positive correlation between the proportion of Spanish Americans and unemployment rate among seniors over the age of 75 in the United States with a correlation coefficient (R) of 0.388 and weighted average of 8.0%, a difference of 4.7%.
Unemployment Among Seniors over 75 years Correlation Summary
| Measurement | Belizean | Spanish American |
| Minimum | 3.0% | 3.0% |
| Maximum | 25.6% | 45.5% |
| Range | 22.6% | 42.5% |
| Mean | 10.4% | 16.4% |
| Median | 9.4% | 11.8% |
| Interquartile 25% (IQ1) | 6.0% | 6.5% |
| Interquartile 75% (IQ3) | 12.8% | 20.7% |
| Interquartile Range (IQR) | 6.7% | 14.2% |
| Standard Deviation (Sample) | 6.0% | 13.7% |
| Standard Deviation (Population) | 5.9% | 13.2% |
Similar Demographics by Unemployment Among Seniors over 75 years
Demographics Similar to Belizeans by Unemployment Among Seniors over 75 years
In terms of unemployment among seniors over 75 years, the demographic groups most similar to Belizeans are Honduran (8.4%, a difference of 0.010%), Native Hawaiian (8.4%, a difference of 0.050%), Ghanaian (8.4%, a difference of 0.090%), Immigrants from Moldova (8.3%, a difference of 0.20%), and Thai (8.3%, a difference of 0.22%).
| Demographics | Rating | Rank | Unemployment Among Seniors over 75 years |
| Japanese | 97.5 /100 | #119 | Exceptional 8.3% |
| Immigrants | Asia | 97.4 /100 | #120 | Exceptional 8.3% |
| Immigrants | Croatia | 97.2 /100 | #121 | Exceptional 8.3% |
| Immigrants | Russia | 97.1 /100 | #122 | Exceptional 8.3% |
| Immigrants | Nepal | 96.9 /100 | #123 | Exceptional 8.3% |
| Thais | 96.8 /100 | #124 | Exceptional 8.3% |
| Immigrants | Moldova | 96.7 /100 | #125 | Exceptional 8.3% |
| Belizeans | 96.3 /100 | #126 | Exceptional 8.4% |
| Hondurans | 96.2 /100 | #127 | Exceptional 8.4% |
| Native Hawaiians | 96.1 /100 | #128 | Exceptional 8.4% |
| Ghanaians | 96.0 /100 | #129 | Exceptional 8.4% |
| Apache | 95.2 /100 | #130 | Exceptional 8.4% |
| German Russians | 94.9 /100 | #131 | Exceptional 8.4% |
| Chileans | 93.8 /100 | #132 | Exceptional 8.4% |
| Serbians | 93.7 /100 | #133 | Exceptional 8.4% |
Demographics Similar to Spanish Americans by Unemployment Among Seniors over 75 years
In terms of unemployment among seniors over 75 years, the demographic groups most similar to Spanish Americans are Immigrants from France (8.0%, a difference of 0.040%), Bolivian (8.0%, a difference of 0.090%), Immigrants from Cambodia (8.0%, a difference of 0.13%), Immigrants from Argentina (8.0%, a difference of 0.20%), and Indian (Asian) (8.0%, a difference of 0.27%).
| Demographics | Rating | Rank | Unemployment Among Seniors over 75 years |
| Immigrants | Syria | 99.9 /100 | #67 | Exceptional 8.0% |
| Immigrants | South Africa | 99.9 /100 | #68 | Exceptional 8.0% |
| Indians (Asian) | 99.9 /100 | #69 | Exceptional 8.0% |
| Immigrants | Argentina | 99.9 /100 | #70 | Exceptional 8.0% |
| Immigrants | Cambodia | 99.9 /100 | #71 | Exceptional 8.0% |
| Bolivians | 99.9 /100 | #72 | Exceptional 8.0% |
| Immigrants | France | 99.9 /100 | #73 | Exceptional 8.0% |
| Spanish Americans | 99.8 /100 | #74 | Exceptional 8.0% |
| Immigrants | Uganda | 99.8 /100 | #75 | Exceptional 8.0% |
| Immigrants | Venezuela | 99.8 /100 | #76 | Exceptional 8.0% |
| Immigrants | Turkey | 99.8 /100 | #77 | Exceptional 8.0% |
| Immigrants | Belarus | 99.8 /100 | #78 | Exceptional 8.0% |
| Immigrants | Japan | 99.7 /100 | #79 | Exceptional 8.0% |
| Immigrants | Australia | 99.7 /100 | #80 | Exceptional 8.0% |
| Cubans | 99.7 /100 | #81 | Exceptional 8.0% |