Alaskan Athabascan vs Pennsylvania German Unemployment Among Seniors over 75 years
COMPARE
Alaskan Athabascan
Pennsylvania German
Unemployment Among Seniors over 75 years
Unemployment Among Seniors over 75 years Comparison
Alaskan Athabascans
Pennsylvania Germans
11.0%
UNEMPLOYMENT AMONG SENIORS OVER 75 YEARS
0.0/ 100
METRIC RATING
333rd/ 347
METRIC RANK
10.2%
UNEMPLOYMENT AMONG SENIORS OVER 75 YEARS
0.0/ 100
METRIC RATING
315th/ 347
METRIC RANK
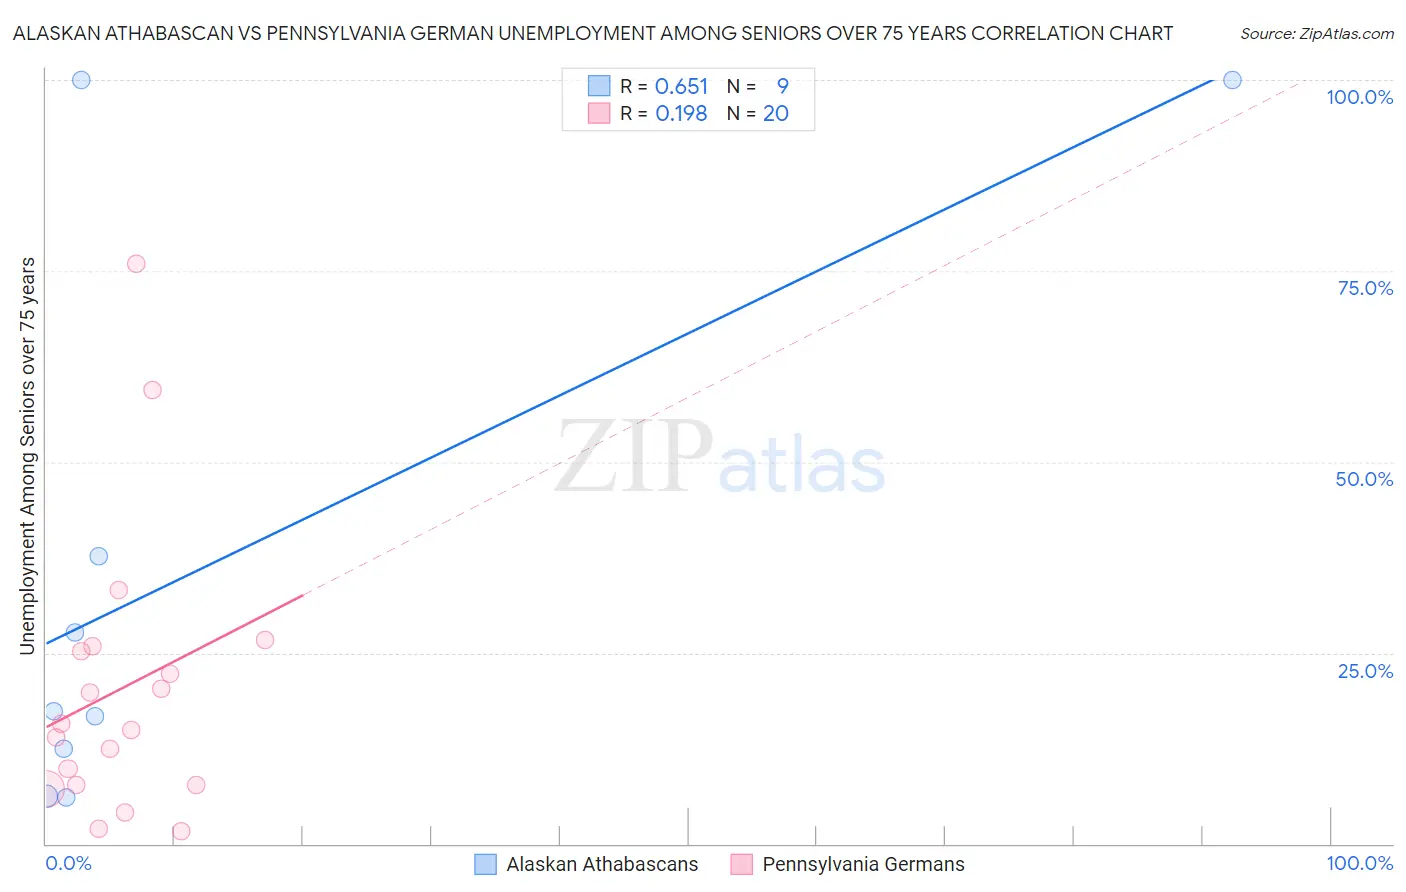
Alaskan Athabascan vs Pennsylvania German Unemployment Among Seniors over 75 years Correlation Chart
The statistical analysis conducted on geographies consisting of 36,036,247 people shows a significant positive correlation between the proportion of Alaskan Athabascans and unemployment rate among seniors over the age of 75 in the United States with a correlation coefficient (R) of 0.651 and weighted average of 11.0%. Similarly, the statistical analysis conducted on geographies consisting of 137,367,352 people shows a poor positive correlation between the proportion of Pennsylvania Germans and unemployment rate among seniors over the age of 75 in the United States with a correlation coefficient (R) of 0.198 and weighted average of 10.2%, a difference of 8.3%.
Unemployment Among Seniors over 75 years Correlation Summary
| Measurement | Alaskan Athabascan | Pennsylvania German |
| Minimum | 6.0% | 1.7% |
| Maximum | 100.0% | 76.0% |
| Range | 94.0% | 74.3% |
| Mean | 36.0% | 20.3% |
| Median | 17.3% | 15.3% |
| Interquartile 25% (IQ1) | 9.4% | 7.7% |
| Interquartile 75% (IQ3) | 68.8% | 25.5% |
| Interquartile Range (IQR) | 59.5% | 17.9% |
| Standard Deviation (Sample) | 37.6% | 18.6% |
| Standard Deviation (Population) | 35.5% | 18.2% |
Demographics Similar to Alaskan Athabascans and Pennsylvania Germans by Unemployment Among Seniors over 75 years
In terms of unemployment among seniors over 75 years, the demographic groups most similar to Alaskan Athabascans are Assyrian/Chaldean/Syriac (11.1%, a difference of 0.35%), Immigrants from Liberia (10.9%, a difference of 1.2%), Tohono O'odham (10.8%, a difference of 1.9%), Immigrants from the Azores (10.7%, a difference of 2.9%), and Tsimshian (10.5%, a difference of 4.5%). Similarly, the demographic groups most similar to Pennsylvania Germans are Dutch West Indian (10.2%, a difference of 0.12%), Native/Alaskan (10.2%, a difference of 0.24%), Irish (10.2%, a difference of 0.61%), Liberian (10.2%, a difference of 0.73%), and German (10.3%, a difference of 0.80%).
| Demographics | Rating | Rank | Unemployment Among Seniors over 75 years |
| Dutch West Indians | 0.0 /100 | #314 | Tragic 10.2% |
| Pennsylvania Germans | 0.0 /100 | #315 | Tragic 10.2% |
| Natives/Alaskans | 0.0 /100 | #316 | Tragic 10.2% |
| Irish | 0.0 /100 | #317 | Tragic 10.2% |
| Liberians | 0.0 /100 | #318 | Tragic 10.2% |
| Germans | 0.0 /100 | #319 | Tragic 10.3% |
| French | 0.0 /100 | #320 | Tragic 10.3% |
| Aleuts | 0.0 /100 | #321 | Tragic 10.3% |
| Poles | 0.0 /100 | #322 | Tragic 10.3% |
| Tongans | 0.0 /100 | #323 | Tragic 10.4% |
| Americans | 0.0 /100 | #324 | Tragic 10.4% |
| Portuguese | 0.0 /100 | #325 | Tragic 10.4% |
| Slovaks | 0.0 /100 | #326 | Tragic 10.4% |
| Dutch | 0.0 /100 | #327 | Tragic 10.4% |
| Immigrants | Portugal | 0.0 /100 | #328 | Tragic 10.5% |
| Tsimshian | 0.0 /100 | #329 | Tragic 10.5% |
| Immigrants | Azores | 0.0 /100 | #330 | Tragic 10.7% |
| Tohono O'odham | 0.0 /100 | #331 | Tragic 10.8% |
| Immigrants | Liberia | 0.0 /100 | #332 | Tragic 10.9% |
| Alaskan Athabascans | 0.0 /100 | #333 | Tragic 11.0% |
| Assyrians/Chaldeans/Syriacs | 0.0 /100 | #334 | Tragic 11.1% |