Sioux vs Somali Unemployment Among Women with Children Under 18 years
COMPARE
Sioux
Somali
Unemployment Among Women with Children Under 18 years
Unemployment Among Women with Children Under 18 years Comparison
Sioux
Somalis
7.9%
UNEMPLOYMENT AMONG WOMEN WITH CHILDREN UNDER 18 YEARS
0.0/ 100
METRIC RATING
336th/ 347
METRIC RANK
5.8%
UNEMPLOYMENT AMONG WOMEN WITH CHILDREN UNDER 18 YEARS
3.5/ 100
METRIC RATING
228th/ 347
METRIC RANK
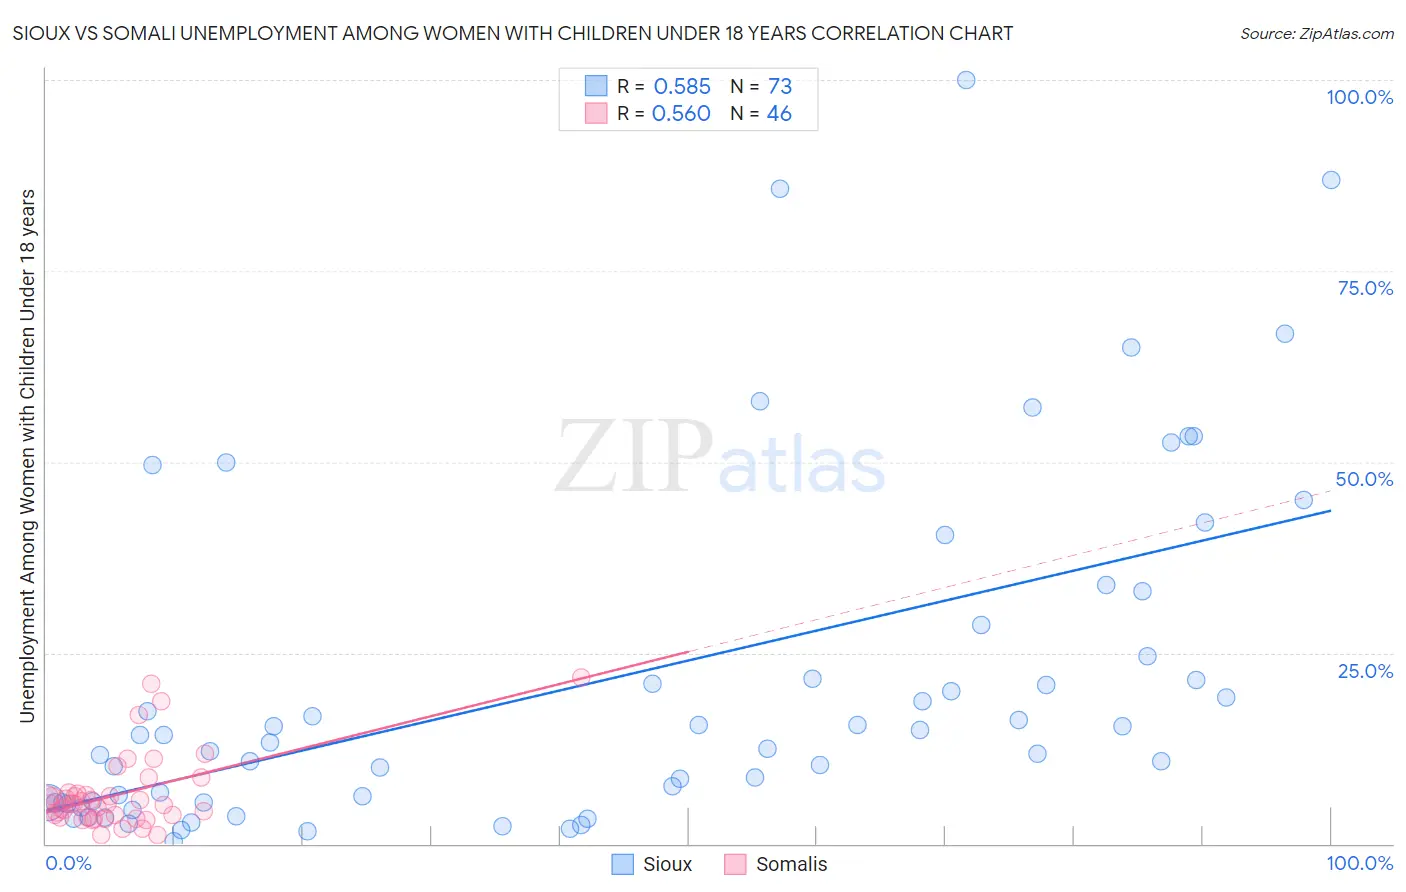
Sioux vs Somali Unemployment Among Women with Children Under 18 years Correlation Chart
The statistical analysis conducted on geographies consisting of 225,822,460 people shows a substantial positive correlation between the proportion of Sioux and unemployment rate among women with children under the age of 18 in the United States with a correlation coefficient (R) of 0.585 and weighted average of 7.9%. Similarly, the statistical analysis conducted on geographies consisting of 97,989,792 people shows a substantial positive correlation between the proportion of Somalis and unemployment rate among women with children under the age of 18 in the United States with a correlation coefficient (R) of 0.560 and weighted average of 5.8%, a difference of 37.7%.
Unemployment Among Women with Children Under 18 years Correlation Summary
| Measurement | Sioux | Somali |
| Minimum | 0.33% | 1.1% |
| Maximum | 100.0% | 21.7% |
| Range | 99.7% | 20.6% |
| Mean | 21.3% | 6.5% |
| Median | 13.2% | 5.3% |
| Interquartile 25% (IQ1) | 5.4% | 3.5% |
| Interquartile 75% (IQ3) | 26.6% | 6.6% |
| Interquartile Range (IQR) | 21.1% | 3.1% |
| Standard Deviation (Sample) | 22.6% | 4.8% |
| Standard Deviation (Population) | 22.5% | 4.7% |
Similar Demographics by Unemployment Among Women with Children Under 18 years
Demographics Similar to Sioux by Unemployment Among Women with Children Under 18 years
In terms of unemployment among women with children under 18 years, the demographic groups most similar to Sioux are Apache (7.9%, a difference of 0.30%), Cheyenne (7.8%, a difference of 1.3%), Yakama (8.1%, a difference of 1.4%), Immigrants from Yemen (8.2%, a difference of 3.1%), and Navajo (8.2%, a difference of 3.6%).
| Demographics | Rating | Rank | Unemployment Among Women with Children Under 18 years |
| Blacks/African Americans | 0.0 /100 | #329 | Tragic 7.3% |
| Colville | 0.0 /100 | #330 | Tragic 7.4% |
| Hopi | 0.0 /100 | #331 | Tragic 7.4% |
| Dominicans | 0.0 /100 | #332 | Tragic 7.5% |
| Immigrants | Dominican Republic | 0.0 /100 | #333 | Tragic 7.5% |
| Cheyenne | 0.0 /100 | #334 | Tragic 7.8% |
| Apache | 0.0 /100 | #335 | Tragic 7.9% |
| Sioux | 0.0 /100 | #336 | Tragic 7.9% |
| Yakama | 0.0 /100 | #337 | Tragic 8.1% |
| Immigrants | Yemen | 0.0 /100 | #338 | Tragic 8.2% |
| Navajo | 0.0 /100 | #339 | Tragic 8.2% |
| Crow | 0.0 /100 | #340 | Tragic 8.2% |
| Tohono O'odham | 0.0 /100 | #341 | Tragic 8.9% |
| Puerto Ricans | 0.0 /100 | #342 | Tragic 9.0% |
| Arapaho | 0.0 /100 | #343 | Tragic 9.2% |
Demographics Similar to Somalis by Unemployment Among Women with Children Under 18 years
In terms of unemployment among women with children under 18 years, the demographic groups most similar to Somalis are Immigrants from Panama (5.8%, a difference of 0.090%), Sierra Leonean (5.8%, a difference of 0.14%), Immigrants from South America (5.8%, a difference of 0.15%), Immigrants from Africa (5.8%, a difference of 0.21%), and Creek (5.8%, a difference of 0.24%).
| Demographics | Rating | Rank | Unemployment Among Women with Children Under 18 years |
| Pennsylvania Germans | 5.7 /100 | #221 | Tragic 5.7% |
| Osage | 5.0 /100 | #222 | Tragic 5.7% |
| Potawatomi | 5.0 /100 | #223 | Tragic 5.7% |
| Immigrants | Syria | 4.6 /100 | #224 | Tragic 5.7% |
| Armenians | 4.5 /100 | #225 | Tragic 5.7% |
| Cherokee | 4.3 /100 | #226 | Tragic 5.7% |
| Sierra Leoneans | 3.8 /100 | #227 | Tragic 5.8% |
| Somalis | 3.5 /100 | #228 | Tragic 5.8% |
| Immigrants | Panama | 3.4 /100 | #229 | Tragic 5.8% |
| Immigrants | South America | 3.2 /100 | #230 | Tragic 5.8% |
| Immigrants | Africa | 3.1 /100 | #231 | Tragic 5.8% |
| Creek | 3.1 /100 | #232 | Tragic 5.8% |
| Spanish Americans | 3.1 /100 | #233 | Tragic 5.8% |
| Guamanians/Chamorros | 2.9 /100 | #234 | Tragic 5.8% |
| Immigrants | Middle Africa | 2.8 /100 | #235 | Tragic 5.8% |