Alaskan Athabascan vs Immigrants from Sri Lanka Unemployment Among Ages 20 to 24 years
COMPARE
Alaskan Athabascan
Immigrants from Sri Lanka
Unemployment Among Ages 20 to 24 years
Unemployment Among Ages 20 to 24 years Comparison
Alaskan Athabascans
Immigrants from Sri Lanka
11.6%
UNEMPLOYMENT AMONG AGES 20 TO 24 YEARS
0.0/ 100
METRIC RATING
280th/ 347
METRIC RANK
10.5%
UNEMPLOYMENT AMONG AGES 20 TO 24 YEARS
14.0/ 100
METRIC RATING
212th/ 347
METRIC RANK
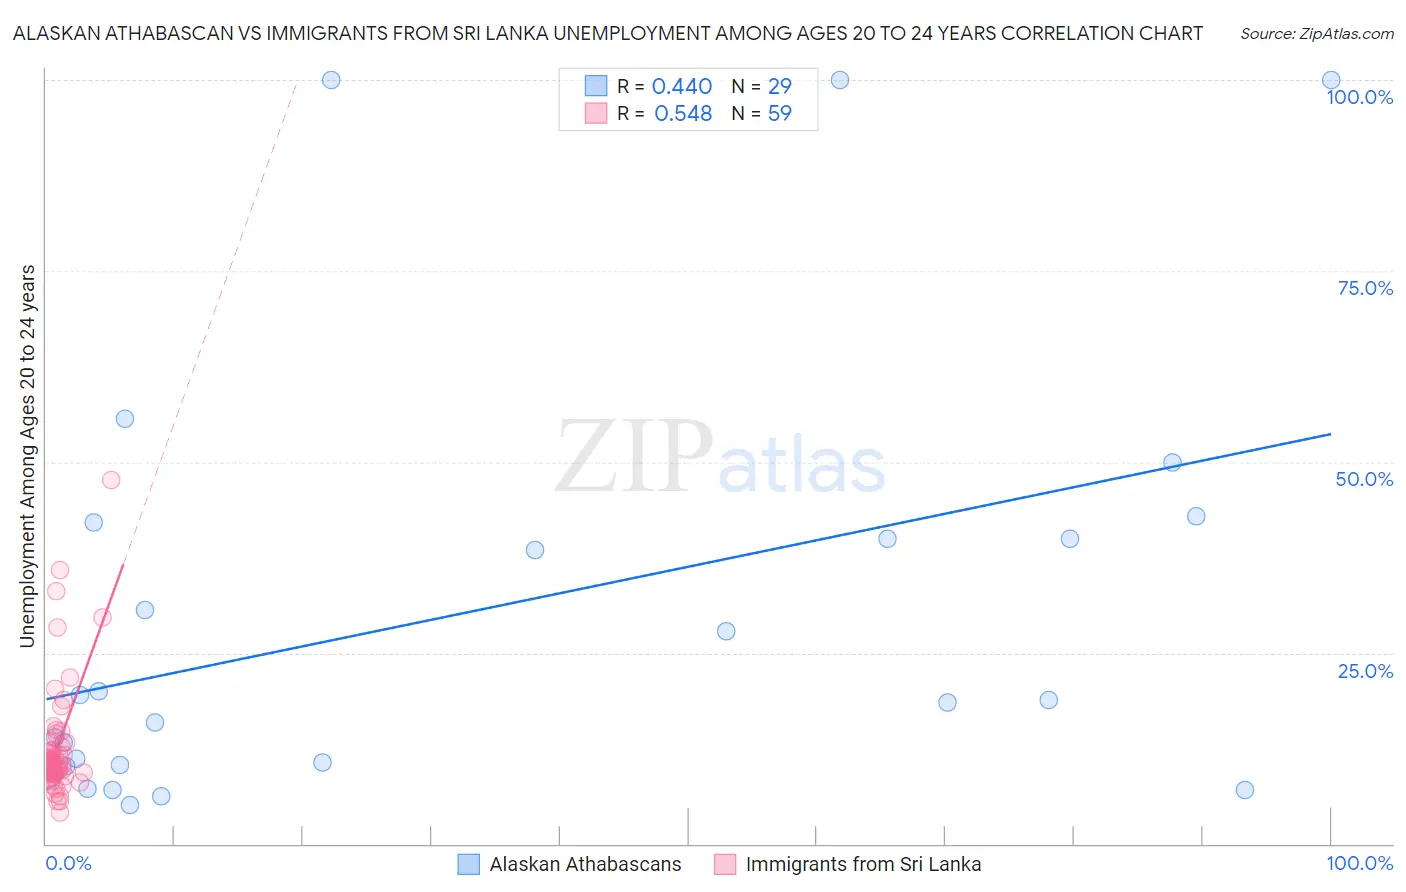
Alaskan Athabascan vs Immigrants from Sri Lanka Unemployment Among Ages 20 to 24 years Correlation Chart
The statistical analysis conducted on geographies consisting of 45,208,950 people shows a moderate positive correlation between the proportion of Alaskan Athabascans and unemployment rate among population between the ages 20 and 24 in the United States with a correlation coefficient (R) of 0.440 and weighted average of 11.6%. Similarly, the statistical analysis conducted on geographies consisting of 148,758,891 people shows a substantial positive correlation between the proportion of Immigrants from Sri Lanka and unemployment rate among population between the ages 20 and 24 in the United States with a correlation coefficient (R) of 0.548 and weighted average of 10.5%, a difference of 10.9%.
Unemployment Among Ages 20 to 24 years Correlation Summary
| Measurement | Alaskan Athabascan | Immigrants from Sri Lanka |
| Minimum | 5.0% | 4.1% |
| Maximum | 100.0% | 47.7% |
| Range | 95.0% | 43.6% |
| Mean | 30.0% | 12.9% |
| Median | 18.8% | 10.6% |
| Interquartile 25% (IQ1) | 10.2% | 9.4% |
| Interquartile 75% (IQ3) | 41.1% | 13.3% |
| Interquartile Range (IQR) | 30.9% | 3.9% |
| Standard Deviation (Sample) | 28.2% | 7.8% |
| Standard Deviation (Population) | 27.7% | 7.7% |
Similar Demographics by Unemployment Among Ages 20 to 24 years
Demographics Similar to Alaskan Athabascans by Unemployment Among Ages 20 to 24 years
In terms of unemployment among ages 20 to 24 years, the demographic groups most similar to Alaskan Athabascans are Bahamian (11.6%, a difference of 0.35%), Armenian (11.7%, a difference of 0.47%), Colville (11.6%, a difference of 0.60%), Immigrants from Cameroon (11.7%, a difference of 0.62%), and African (11.5%, a difference of 0.63%).
| Demographics | Rating | Rank | Unemployment Among Ages 20 to 24 years |
| Immigrants | Nigeria | 0.0 /100 | #273 | Tragic 11.5% |
| Cape Verdeans | 0.0 /100 | #274 | Tragic 11.5% |
| Senegalese | 0.0 /100 | #275 | Tragic 11.5% |
| Sierra Leoneans | 0.0 /100 | #276 | Tragic 11.5% |
| Africans | 0.0 /100 | #277 | Tragic 11.5% |
| Colville | 0.0 /100 | #278 | Tragic 11.6% |
| Bahamians | 0.0 /100 | #279 | Tragic 11.6% |
| Alaskan Athabascans | 0.0 /100 | #280 | Tragic 11.6% |
| Armenians | 0.0 /100 | #281 | Tragic 11.7% |
| Immigrants | Cameroon | 0.0 /100 | #282 | Tragic 11.7% |
| Ghanaians | 0.0 /100 | #283 | Tragic 11.7% |
| Immigrants | Western Africa | 0.0 /100 | #284 | Tragic 11.7% |
| Soviet Union | 0.0 /100 | #285 | Tragic 11.7% |
| Ecuadorians | 0.0 /100 | #286 | Tragic 11.8% |
| Immigrants | Ecuador | 0.0 /100 | #287 | Tragic 11.8% |
Demographics Similar to Immigrants from Sri Lanka by Unemployment Among Ages 20 to 24 years
In terms of unemployment among ages 20 to 24 years, the demographic groups most similar to Immigrants from Sri Lanka are Immigrants from Guatemala (10.5%, a difference of 0.040%), Guatemalan (10.5%, a difference of 0.14%), Kiowa (10.5%, a difference of 0.18%), Immigrants from Belgium (10.5%, a difference of 0.20%), and Peruvian (10.5%, a difference of 0.22%).
| Demographics | Rating | Rank | Unemployment Among Ages 20 to 24 years |
| Cypriots | 18.9 /100 | #205 | Poor 10.4% |
| Immigrants | Europe | 18.5 /100 | #206 | Poor 10.4% |
| Immigrants | Honduras | 17.9 /100 | #207 | Poor 10.4% |
| Immigrants | Hong Kong | 17.6 /100 | #208 | Poor 10.5% |
| Peruvians | 17.2 /100 | #209 | Poor 10.5% |
| Immigrants | Belgium | 16.9 /100 | #210 | Poor 10.5% |
| Immigrants | Guatemala | 14.6 /100 | #211 | Poor 10.5% |
| Immigrants | Sri Lanka | 14.0 /100 | #212 | Poor 10.5% |
| Guatemalans | 12.2 /100 | #213 | Poor 10.5% |
| Kiowa | 11.7 /100 | #214 | Poor 10.5% |
| Hondurans | 10.5 /100 | #215 | Poor 10.5% |
| Costa Ricans | 9.6 /100 | #216 | Tragic 10.5% |
| Cherokee | 9.3 /100 | #217 | Tragic 10.5% |
| Immigrants | Nonimmigrants | 8.8 /100 | #218 | Tragic 10.5% |
| Immigrants | Southern Europe | 8.0 /100 | #219 | Tragic 10.5% |