Alaskan Athabascan vs Immigrants from Norway Unemployment Among Ages 20 to 24 years
COMPARE
Alaskan Athabascan
Immigrants from Norway
Unemployment Among Ages 20 to 24 years
Unemployment Among Ages 20 to 24 years Comparison
Alaskan Athabascans
Immigrants from Norway
11.6%
UNEMPLOYMENT AMONG AGES 20 TO 24 YEARS
0.0/ 100
METRIC RATING
280th/ 347
METRIC RANK
10.1%
UNEMPLOYMENT AMONG AGES 20 TO 24 YEARS
85.3/ 100
METRIC RATING
127th/ 347
METRIC RANK
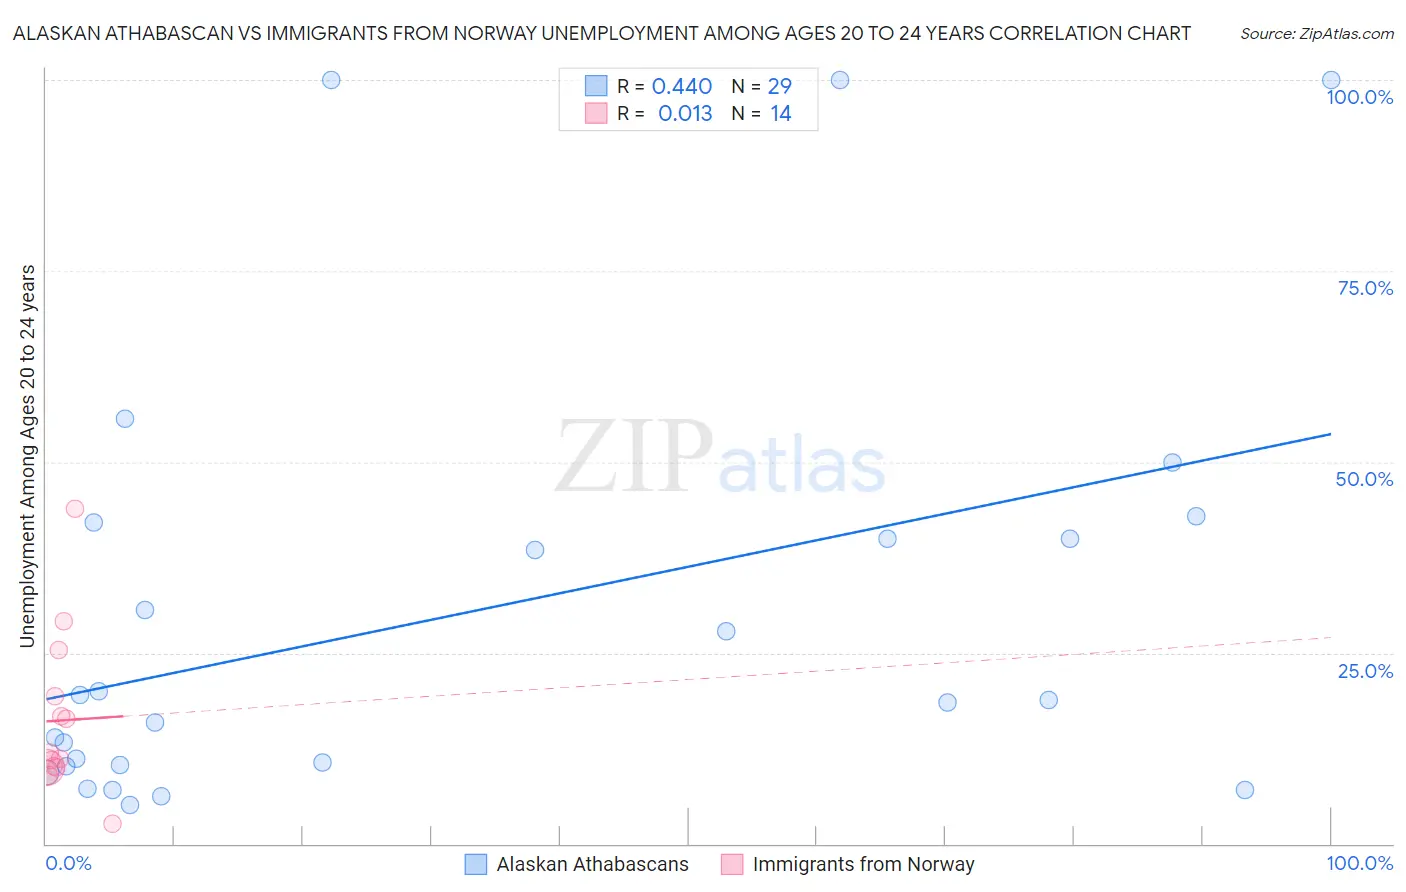
Alaskan Athabascan vs Immigrants from Norway Unemployment Among Ages 20 to 24 years Correlation Chart
The statistical analysis conducted on geographies consisting of 45,208,950 people shows a moderate positive correlation between the proportion of Alaskan Athabascans and unemployment rate among population between the ages 20 and 24 in the United States with a correlation coefficient (R) of 0.440 and weighted average of 11.6%. Similarly, the statistical analysis conducted on geographies consisting of 115,468,056 people shows no correlation between the proportion of Immigrants from Norway and unemployment rate among population between the ages 20 and 24 in the United States with a correlation coefficient (R) of 0.013 and weighted average of 10.1%, a difference of 14.6%.
Unemployment Among Ages 20 to 24 years Correlation Summary
| Measurement | Alaskan Athabascan | Immigrants from Norway |
| Minimum | 5.0% | 2.6% |
| Maximum | 100.0% | 43.8% |
| Range | 95.0% | 41.2% |
| Mean | 30.0% | 16.2% |
| Median | 18.8% | 11.5% |
| Interquartile 25% (IQ1) | 10.2% | 10.0% |
| Interquartile 75% (IQ3) | 41.1% | 19.3% |
| Interquartile Range (IQR) | 30.9% | 9.3% |
| Standard Deviation (Sample) | 28.2% | 10.5% |
| Standard Deviation (Population) | 27.7% | 10.2% |
Similar Demographics by Unemployment Among Ages 20 to 24 years
Demographics Similar to Alaskan Athabascans by Unemployment Among Ages 20 to 24 years
In terms of unemployment among ages 20 to 24 years, the demographic groups most similar to Alaskan Athabascans are Bahamian (11.6%, a difference of 0.35%), Armenian (11.7%, a difference of 0.47%), Colville (11.6%, a difference of 0.60%), Immigrants from Cameroon (11.7%, a difference of 0.62%), and African (11.5%, a difference of 0.63%).
| Demographics | Rating | Rank | Unemployment Among Ages 20 to 24 years |
| Immigrants | Nigeria | 0.0 /100 | #273 | Tragic 11.5% |
| Cape Verdeans | 0.0 /100 | #274 | Tragic 11.5% |
| Senegalese | 0.0 /100 | #275 | Tragic 11.5% |
| Sierra Leoneans | 0.0 /100 | #276 | Tragic 11.5% |
| Africans | 0.0 /100 | #277 | Tragic 11.5% |
| Colville | 0.0 /100 | #278 | Tragic 11.6% |
| Bahamians | 0.0 /100 | #279 | Tragic 11.6% |
| Alaskan Athabascans | 0.0 /100 | #280 | Tragic 11.6% |
| Armenians | 0.0 /100 | #281 | Tragic 11.7% |
| Immigrants | Cameroon | 0.0 /100 | #282 | Tragic 11.7% |
| Ghanaians | 0.0 /100 | #283 | Tragic 11.7% |
| Immigrants | Western Africa | 0.0 /100 | #284 | Tragic 11.7% |
| Soviet Union | 0.0 /100 | #285 | Tragic 11.7% |
| Ecuadorians | 0.0 /100 | #286 | Tragic 11.8% |
| Immigrants | Ecuador | 0.0 /100 | #287 | Tragic 11.8% |
Demographics Similar to Immigrants from Norway by Unemployment Among Ages 20 to 24 years
In terms of unemployment among ages 20 to 24 years, the demographic groups most similar to Immigrants from Norway are Immigrants from Brazil (10.1%, a difference of 0.030%), Immigrants from South Central Asia (10.1%, a difference of 0.050%), Jordanian (10.1%, a difference of 0.060%), Spanish (10.1%, a difference of 0.070%), and Immigrants from Lithuania (10.1%, a difference of 0.080%).
| Demographics | Rating | Rank | Unemployment Among Ages 20 to 24 years |
| Immigrants | Canada | 88.2 /100 | #120 | Excellent 10.1% |
| South Africans | 87.8 /100 | #121 | Excellent 10.1% |
| Whites/Caucasians | 87.4 /100 | #122 | Excellent 10.1% |
| Immigrants | Iraq | 87.1 /100 | #123 | Excellent 10.1% |
| Immigrants | Japan | 86.5 /100 | #124 | Excellent 10.1% |
| Spanish | 86.1 /100 | #125 | Excellent 10.1% |
| Jordanians | 86.1 /100 | #126 | Excellent 10.1% |
| Immigrants | Norway | 85.3 /100 | #127 | Excellent 10.1% |
| Immigrants | Brazil | 84.9 /100 | #128 | Excellent 10.1% |
| Immigrants | South Central Asia | 84.6 /100 | #129 | Excellent 10.1% |
| Immigrants | Lithuania | 84.2 /100 | #130 | Excellent 10.1% |
| Seminole | 84.2 /100 | #131 | Excellent 10.1% |
| Immigrants | South Eastern Asia | 84.0 /100 | #132 | Excellent 10.1% |
| Austrians | 83.9 /100 | #133 | Excellent 10.2% |
| Romanians | 83.8 /100 | #134 | Excellent 10.2% |