Immigrants from Fiji vs Immigrants from Norway Unemployment Among Ages 20 to 24 years
COMPARE
Immigrants from Fiji
Immigrants from Norway
Unemployment Among Ages 20 to 24 years
Unemployment Among Ages 20 to 24 years Comparison
Immigrants from Fiji
Immigrants from Norway
10.3%
UNEMPLOYMENT AMONG AGES 20 TO 24 YEARS
57.6/ 100
METRIC RATING
167th/ 347
METRIC RANK
10.1%
UNEMPLOYMENT AMONG AGES 20 TO 24 YEARS
85.3/ 100
METRIC RATING
127th/ 347
METRIC RANK
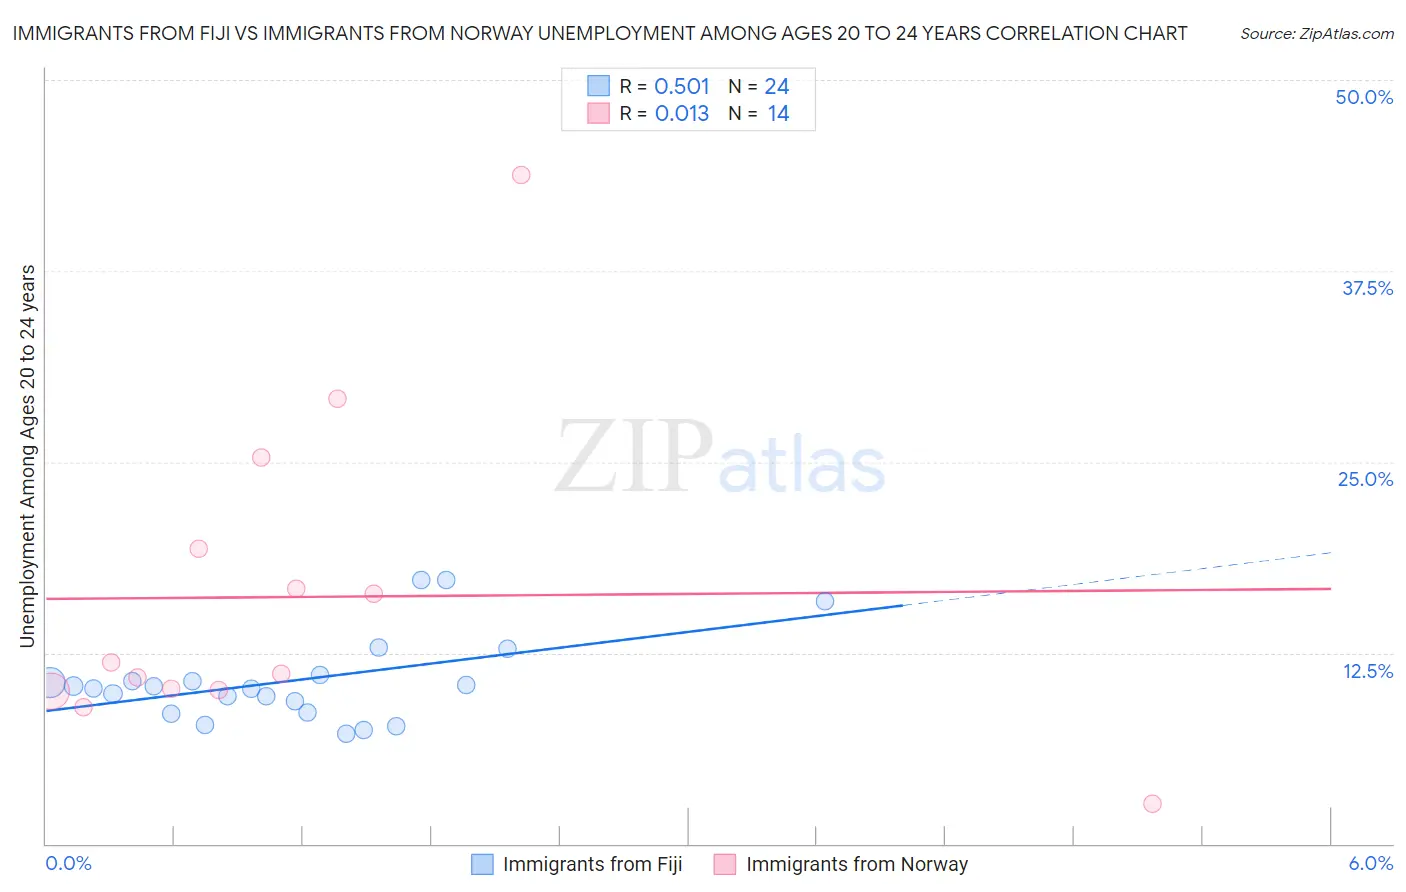
Immigrants from Fiji vs Immigrants from Norway Unemployment Among Ages 20 to 24 years Correlation Chart
The statistical analysis conducted on geographies consisting of 93,497,252 people shows a substantial positive correlation between the proportion of Immigrants from Fiji and unemployment rate among population between the ages 20 and 24 in the United States with a correlation coefficient (R) of 0.501 and weighted average of 10.3%. Similarly, the statistical analysis conducted on geographies consisting of 115,468,056 people shows no correlation between the proportion of Immigrants from Norway and unemployment rate among population between the ages 20 and 24 in the United States with a correlation coefficient (R) of 0.013 and weighted average of 10.1%, a difference of 1.3%.
Unemployment Among Ages 20 to 24 years Correlation Summary
| Measurement | Immigrants from Fiji | Immigrants from Norway |
| Minimum | 7.2% | 2.6% |
| Maximum | 17.3% | 43.8% |
| Range | 10.1% | 41.2% |
| Mean | 10.7% | 16.2% |
| Median | 10.2% | 11.5% |
| Interquartile 25% (IQ1) | 9.0% | 10.0% |
| Interquartile 75% (IQ3) | 10.8% | 19.3% |
| Interquartile Range (IQR) | 1.9% | 9.3% |
| Standard Deviation (Sample) | 2.8% | 10.5% |
| Standard Deviation (Population) | 2.7% | 10.2% |
Similar Demographics by Unemployment Among Ages 20 to 24 years
Demographics Similar to Immigrants from Fiji by Unemployment Among Ages 20 to 24 years
In terms of unemployment among ages 20 to 24 years, the demographic groups most similar to Immigrants from Fiji are Italian (10.3%, a difference of 0.0%), Lebanese (10.3%, a difference of 0.020%), Iraqi (10.3%, a difference of 0.030%), Immigrants from Korea (10.3%, a difference of 0.050%), and Immigrants from Colombia (10.3%, a difference of 0.050%).
| Demographics | Rating | Rank | Unemployment Among Ages 20 to 24 years |
| Spaniards | 63.4 /100 | #160 | Good 10.3% |
| Indians (Asian) | 62.6 /100 | #161 | Good 10.3% |
| Immigrants | Asia | 61.3 /100 | #162 | Good 10.3% |
| Estonians | 61.1 /100 | #163 | Good 10.3% |
| Immigrants | Korea | 59.0 /100 | #164 | Average 10.3% |
| Lebanese | 58.3 /100 | #165 | Average 10.3% |
| Italians | 57.7 /100 | #166 | Average 10.3% |
| Immigrants | Fiji | 57.6 /100 | #167 | Average 10.3% |
| Iraqis | 56.7 /100 | #168 | Average 10.3% |
| Immigrants | Colombia | 56.3 /100 | #169 | Average 10.3% |
| Turks | 55.2 /100 | #170 | Average 10.3% |
| Immigrants | Eastern Asia | 52.7 /100 | #171 | Average 10.3% |
| Koreans | 51.9 /100 | #172 | Average 10.3% |
| Immigrants | Sweden | 50.8 /100 | #173 | Average 10.3% |
| Ukrainians | 50.0 /100 | #174 | Average 10.3% |
Demographics Similar to Immigrants from Norway by Unemployment Among Ages 20 to 24 years
In terms of unemployment among ages 20 to 24 years, the demographic groups most similar to Immigrants from Norway are Immigrants from Brazil (10.1%, a difference of 0.030%), Immigrants from South Central Asia (10.1%, a difference of 0.050%), Jordanian (10.1%, a difference of 0.060%), Spanish (10.1%, a difference of 0.070%), and Immigrants from Lithuania (10.1%, a difference of 0.080%).
| Demographics | Rating | Rank | Unemployment Among Ages 20 to 24 years |
| Immigrants | Canada | 88.2 /100 | #120 | Excellent 10.1% |
| South Africans | 87.8 /100 | #121 | Excellent 10.1% |
| Whites/Caucasians | 87.4 /100 | #122 | Excellent 10.1% |
| Immigrants | Iraq | 87.1 /100 | #123 | Excellent 10.1% |
| Immigrants | Japan | 86.5 /100 | #124 | Excellent 10.1% |
| Spanish | 86.1 /100 | #125 | Excellent 10.1% |
| Jordanians | 86.1 /100 | #126 | Excellent 10.1% |
| Immigrants | Norway | 85.3 /100 | #127 | Excellent 10.1% |
| Immigrants | Brazil | 84.9 /100 | #128 | Excellent 10.1% |
| Immigrants | South Central Asia | 84.6 /100 | #129 | Excellent 10.1% |
| Immigrants | Lithuania | 84.2 /100 | #130 | Excellent 10.1% |
| Seminole | 84.2 /100 | #131 | Excellent 10.1% |
| Immigrants | South Eastern Asia | 84.0 /100 | #132 | Excellent 10.1% |
| Austrians | 83.9 /100 | #133 | Excellent 10.2% |
| Romanians | 83.8 /100 | #134 | Excellent 10.2% |