Seminole vs Immigrants from Egypt Female Unemployment
COMPARE
Seminole
Immigrants from Egypt
Female Unemployment
Female Unemployment Comparison
Seminole
Immigrants from Egypt
5.4%
FEMALE UNEMPLOYMENT
10.3/ 100
METRIC RATING
214th/ 347
METRIC RANK
5.2%
FEMALE UNEMPLOYMENT
70.0/ 100
METRIC RATING
155th/ 347
METRIC RANK
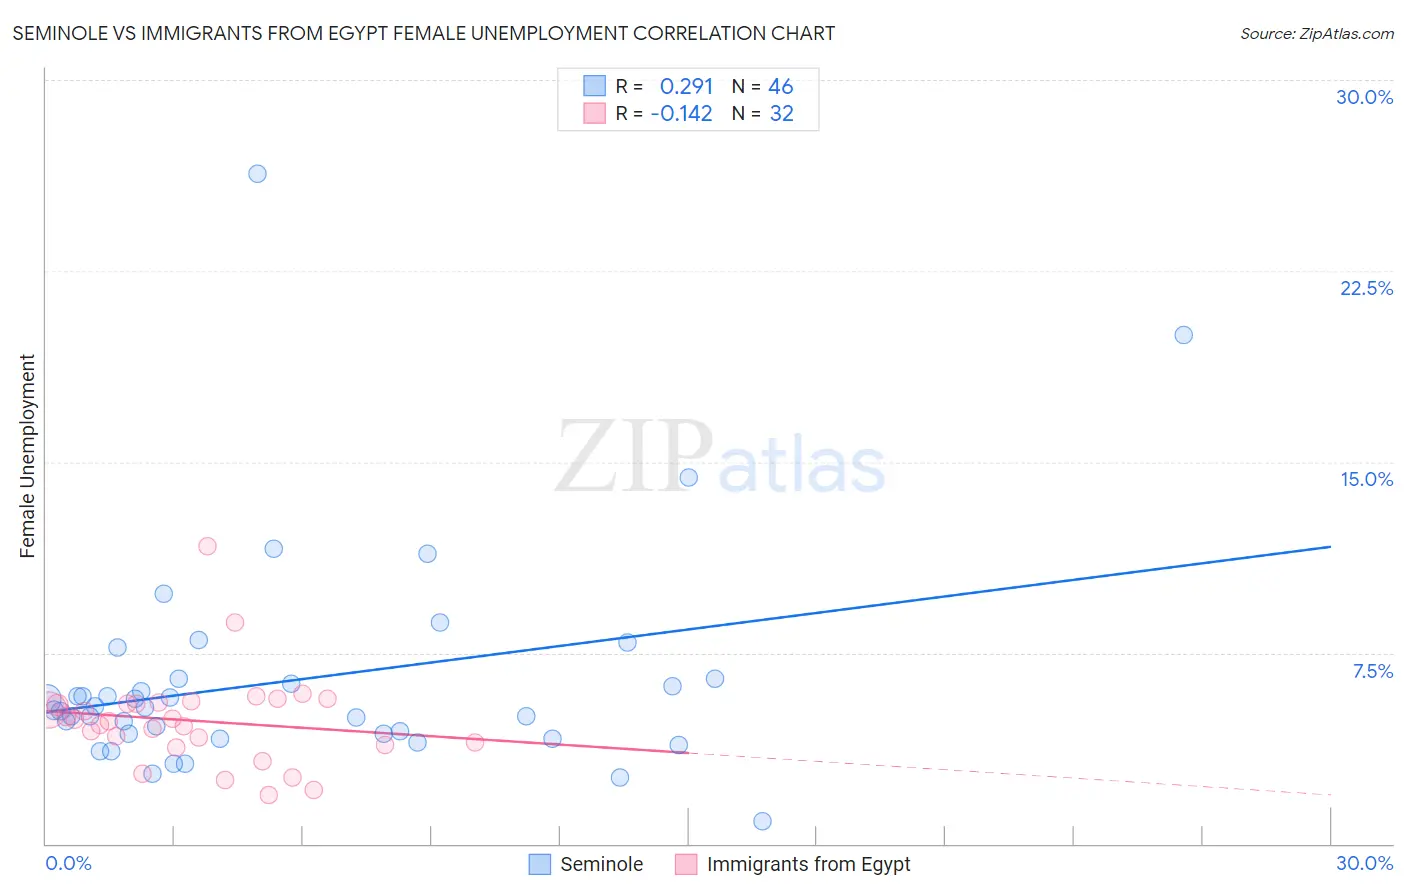
Seminole vs Immigrants from Egypt Female Unemployment Correlation Chart
The statistical analysis conducted on geographies consisting of 118,048,868 people shows a weak positive correlation between the proportion of Seminole and unemploymnet rate among females in the United States with a correlation coefficient (R) of 0.291 and weighted average of 5.4%. Similarly, the statistical analysis conducted on geographies consisting of 245,194,116 people shows a poor negative correlation between the proportion of Immigrants from Egypt and unemploymnet rate among females in the United States with a correlation coefficient (R) of -0.142 and weighted average of 5.2%, a difference of 4.6%.
Female Unemployment Correlation Summary
| Measurement | Seminole | Immigrants from Egypt |
| Minimum | 0.90% | 1.9% |
| Maximum | 26.3% | 11.7% |
| Range | 25.4% | 9.8% |
| Mean | 6.4% | 4.8% |
| Median | 5.3% | 4.8% |
| Interquartile 25% (IQ1) | 4.3% | 4.0% |
| Interquartile 75% (IQ3) | 6.5% | 5.5% |
| Interquartile Range (IQR) | 2.2% | 1.6% |
| Standard Deviation (Sample) | 4.4% | 1.8% |
| Standard Deviation (Population) | 4.4% | 1.8% |
Similar Demographics by Female Unemployment
Demographics Similar to Seminole by Female Unemployment
In terms of female unemployment, the demographic groups most similar to Seminole are Immigrants from Nicaragua (5.4%, a difference of 0.020%), Comanche (5.4%, a difference of 0.040%), Samoan (5.4%, a difference of 0.050%), Peruvian (5.4%, a difference of 0.12%), and Uruguayan (5.4%, a difference of 0.17%).
| Demographics | Rating | Rank | Female Unemployment |
| Creek | 15.4 /100 | #207 | Poor 5.4% |
| Immigrants | Costa Rica | 13.7 /100 | #208 | Poor 5.4% |
| Koreans | 13.4 /100 | #209 | Poor 5.4% |
| Choctaw | 12.3 /100 | #210 | Poor 5.4% |
| Ottawa | 11.6 /100 | #211 | Poor 5.4% |
| Uruguayans | 11.4 /100 | #212 | Poor 5.4% |
| Samoans | 10.6 /100 | #213 | Poor 5.4% |
| Seminole | 10.3 /100 | #214 | Poor 5.4% |
| Immigrants | Nicaragua | 10.2 /100 | #215 | Poor 5.4% |
| Comanche | 10.0 /100 | #216 | Poor 5.4% |
| Peruvians | 9.6 /100 | #217 | Tragic 5.4% |
| Bermudans | 9.0 /100 | #218 | Tragic 5.4% |
| South Americans | 8.6 /100 | #219 | Tragic 5.4% |
| Immigrants | Africa | 8.5 /100 | #220 | Tragic 5.4% |
| Brazilians | 7.3 /100 | #221 | Tragic 5.5% |
Demographics Similar to Immigrants from Egypt by Female Unemployment
In terms of female unemployment, the demographic groups most similar to Immigrants from Egypt are Immigrants from Northern Africa (5.2%, a difference of 0.030%), Immigrants from Russia (5.2%, a difference of 0.050%), South African (5.2%, a difference of 0.060%), Albanian (5.2%, a difference of 0.12%), and Immigrants from Micronesia (5.2%, a difference of 0.22%).
| Demographics | Rating | Rank | Female Unemployment |
| Immigrants | Argentina | 78.7 /100 | #148 | Good 5.2% |
| Asians | 78.3 /100 | #149 | Good 5.2% |
| Egyptians | 78.3 /100 | #150 | Good 5.2% |
| Immigrants | China | 75.9 /100 | #151 | Good 5.2% |
| Immigrants | Italy | 75.0 /100 | #152 | Good 5.2% |
| Immigrants | Greece | 74.9 /100 | #153 | Good 5.2% |
| South Africans | 70.8 /100 | #154 | Good 5.2% |
| Immigrants | Egypt | 70.0 /100 | #155 | Good 5.2% |
| Immigrants | Northern Africa | 69.6 /100 | #156 | Good 5.2% |
| Immigrants | Russia | 69.3 /100 | #157 | Good 5.2% |
| Albanians | 68.3 /100 | #158 | Good 5.2% |
| Immigrants | Micronesia | 66.9 /100 | #159 | Good 5.2% |
| Immigrants | Spain | 66.8 /100 | #160 | Good 5.2% |
| Immigrants | Pakistan | 66.7 /100 | #161 | Good 5.2% |
| Potawatomi | 65.9 /100 | #162 | Good 5.2% |