Afghan vs Sierra Leonean Unemployment Among Seniors over 75 years
COMPARE
Afghan
Sierra Leonean
Unemployment Among Seniors over 75 years
Unemployment Among Seniors over 75 years Comparison
Afghans
Sierra Leoneans
9.0%
UNEMPLOYMENT AMONG SENIORS OVER 75 YEARS
8.3/ 100
METRIC RATING
219th/ 347
METRIC RANK
9.2%
UNEMPLOYMENT AMONG SENIORS OVER 75 YEARS
2.8/ 100
METRIC RATING
242nd/ 347
METRIC RANK
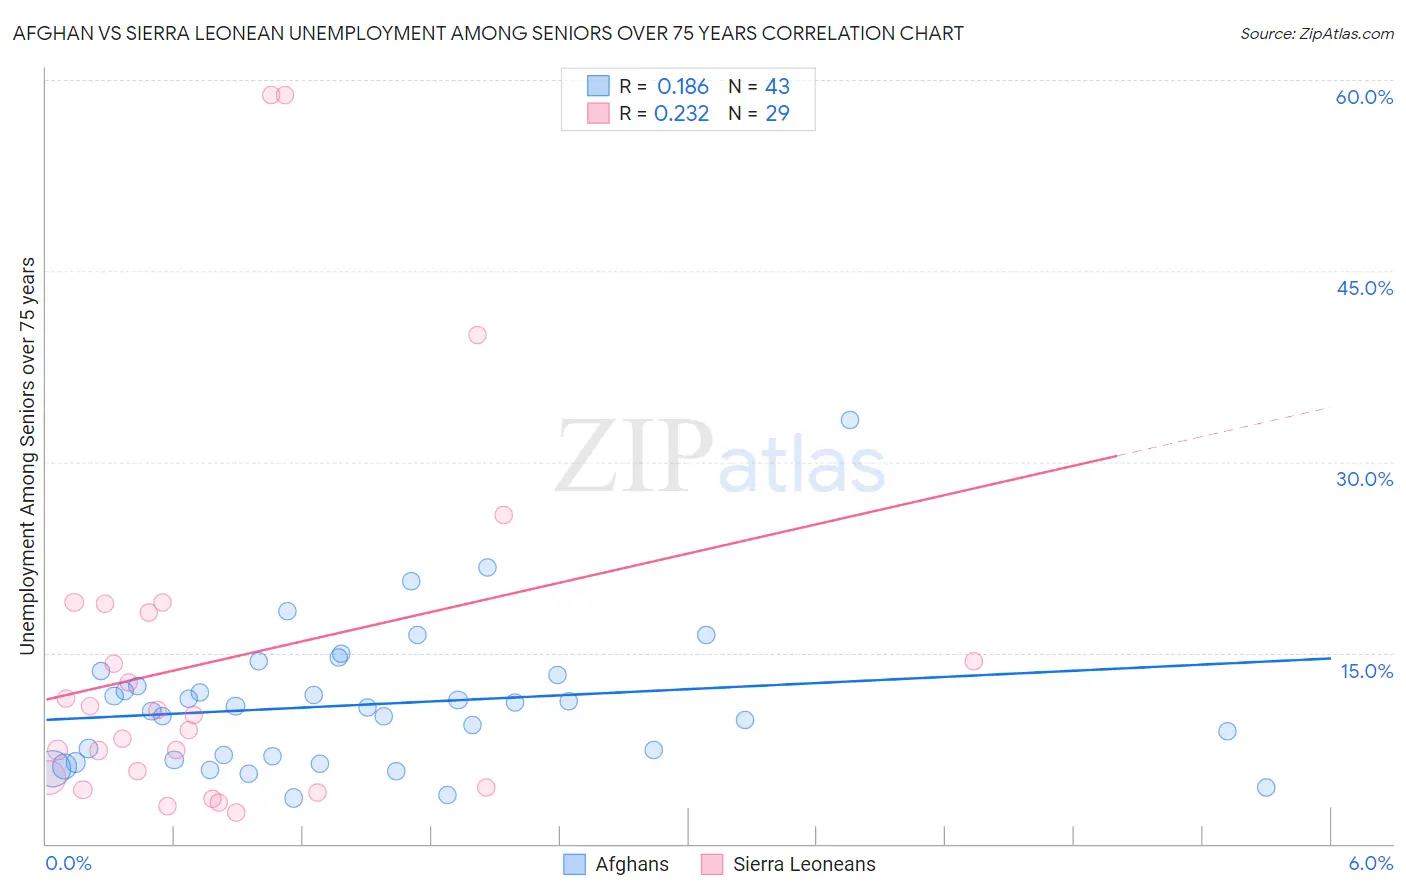
Afghan vs Sierra Leonean Unemployment Among Seniors over 75 years Correlation Chart
The statistical analysis conducted on geographies consisting of 106,248,829 people shows a poor positive correlation between the proportion of Afghans and unemployment rate among seniors over the age of 75 in the United States with a correlation coefficient (R) of 0.186 and weighted average of 9.0%. Similarly, the statistical analysis conducted on geographies consisting of 64,143,831 people shows a weak positive correlation between the proportion of Sierra Leoneans and unemployment rate among seniors over the age of 75 in the United States with a correlation coefficient (R) of 0.232 and weighted average of 9.2%, a difference of 1.5%.
Unemployment Among Seniors over 75 years Correlation Summary
| Measurement | Afghan | Sierra Leonean |
| Minimum | 3.6% | 2.5% |
| Maximum | 33.3% | 58.8% |
| Range | 29.7% | 56.3% |
| Mean | 10.9% | 14.4% |
| Median | 10.7% | 10.1% |
| Interquartile 25% (IQ1) | 6.6% | 4.8% |
| Interquartile 75% (IQ3) | 13.3% | 18.5% |
| Interquartile Range (IQR) | 6.7% | 13.7% |
| Standard Deviation (Sample) | 5.5% | 14.7% |
| Standard Deviation (Population) | 5.5% | 14.5% |
Similar Demographics by Unemployment Among Seniors over 75 years
Demographics Similar to Afghans by Unemployment Among Seniors over 75 years
In terms of unemployment among seniors over 75 years, the demographic groups most similar to Afghans are Immigrants from Zimbabwe (9.0%, a difference of 0.080%), Guamanian/Chamorro (9.0%, a difference of 0.10%), Peruvian (9.0%, a difference of 0.18%), Immigrants from Africa (9.0%, a difference of 0.23%), and Immigrants from Jordan (9.0%, a difference of 0.24%).
| Demographics | Rating | Rank | Unemployment Among Seniors over 75 years |
| Romanians | 13.8 /100 | #212 | Poor 9.0% |
| Immigrants | Latin America | 13.4 /100 | #213 | Poor 9.0% |
| Immigrants | Brazil | 13.3 /100 | #214 | Poor 9.0% |
| Immigrants | Western Asia | 12.5 /100 | #215 | Poor 9.0% |
| Immigrants | Oceania | 11.8 /100 | #216 | Poor 9.0% |
| Lebanese | 11.1 /100 | #217 | Poor 9.0% |
| Immigrants | Africa | 9.7 /100 | #218 | Tragic 9.0% |
| Afghans | 8.3 /100 | #219 | Tragic 9.0% |
| Immigrants | Zimbabwe | 7.8 /100 | #220 | Tragic 9.0% |
| Guamanians/Chamorros | 7.7 /100 | #221 | Tragic 9.0% |
| Peruvians | 7.3 /100 | #222 | Tragic 9.0% |
| Immigrants | Jordan | 6.9 /100 | #223 | Tragic 9.0% |
| Costa Ricans | 6.3 /100 | #224 | Tragic 9.1% |
| Navajo | 6.1 /100 | #225 | Tragic 9.1% |
| Immigrants | Bangladesh | 5.9 /100 | #226 | Tragic 9.1% |
Demographics Similar to Sierra Leoneans by Unemployment Among Seniors over 75 years
In terms of unemployment among seniors over 75 years, the demographic groups most similar to Sierra Leoneans are Slavic (9.2%, a difference of 0.0%), Immigrants from Southern Europe (9.2%, a difference of 0.030%), Immigrants from Germany (9.2%, a difference of 0.030%), Immigrants from Canada (9.2%, a difference of 0.090%), and Immigrants from North America (9.2%, a difference of 0.21%).
| Demographics | Rating | Rank | Unemployment Among Seniors over 75 years |
| Panamanians | 4.0 /100 | #235 | Tragic 9.1% |
| Jordanians | 4.0 /100 | #236 | Tragic 9.1% |
| Houma | 3.9 /100 | #237 | Tragic 9.1% |
| Inupiat | 3.6 /100 | #238 | Tragic 9.1% |
| Mexicans | 3.5 /100 | #239 | Tragic 9.1% |
| Spanish | 3.3 /100 | #240 | Tragic 9.1% |
| Immigrants | Southern Europe | 2.8 /100 | #241 | Tragic 9.2% |
| Sierra Leoneans | 2.8 /100 | #242 | Tragic 9.2% |
| Slavs | 2.8 /100 | #243 | Tragic 9.2% |
| Immigrants | Germany | 2.7 /100 | #244 | Tragic 9.2% |
| Immigrants | Canada | 2.6 /100 | #245 | Tragic 9.2% |
| Immigrants | North America | 2.4 /100 | #246 | Tragic 9.2% |
| Sub-Saharan Africans | 2.3 /100 | #247 | Tragic 9.2% |
| Blackfeet | 2.3 /100 | #248 | Tragic 9.2% |
| Immigrants | Saudi Arabia | 2.2 /100 | #249 | Tragic 9.2% |