Afghan vs Moroccan Unemployment Among Seniors over 75 years
COMPARE
Afghan
Moroccan
Unemployment Among Seniors over 75 years
Unemployment Among Seniors over 75 years Comparison
Afghans
Moroccans
9.0%
UNEMPLOYMENT AMONG SENIORS OVER 75 YEARS
8.3/ 100
METRIC RATING
219th/ 347
METRIC RANK
7.8%
UNEMPLOYMENT AMONG SENIORS OVER 75 YEARS
100.0/ 100
METRIC RATING
51st/ 347
METRIC RANK
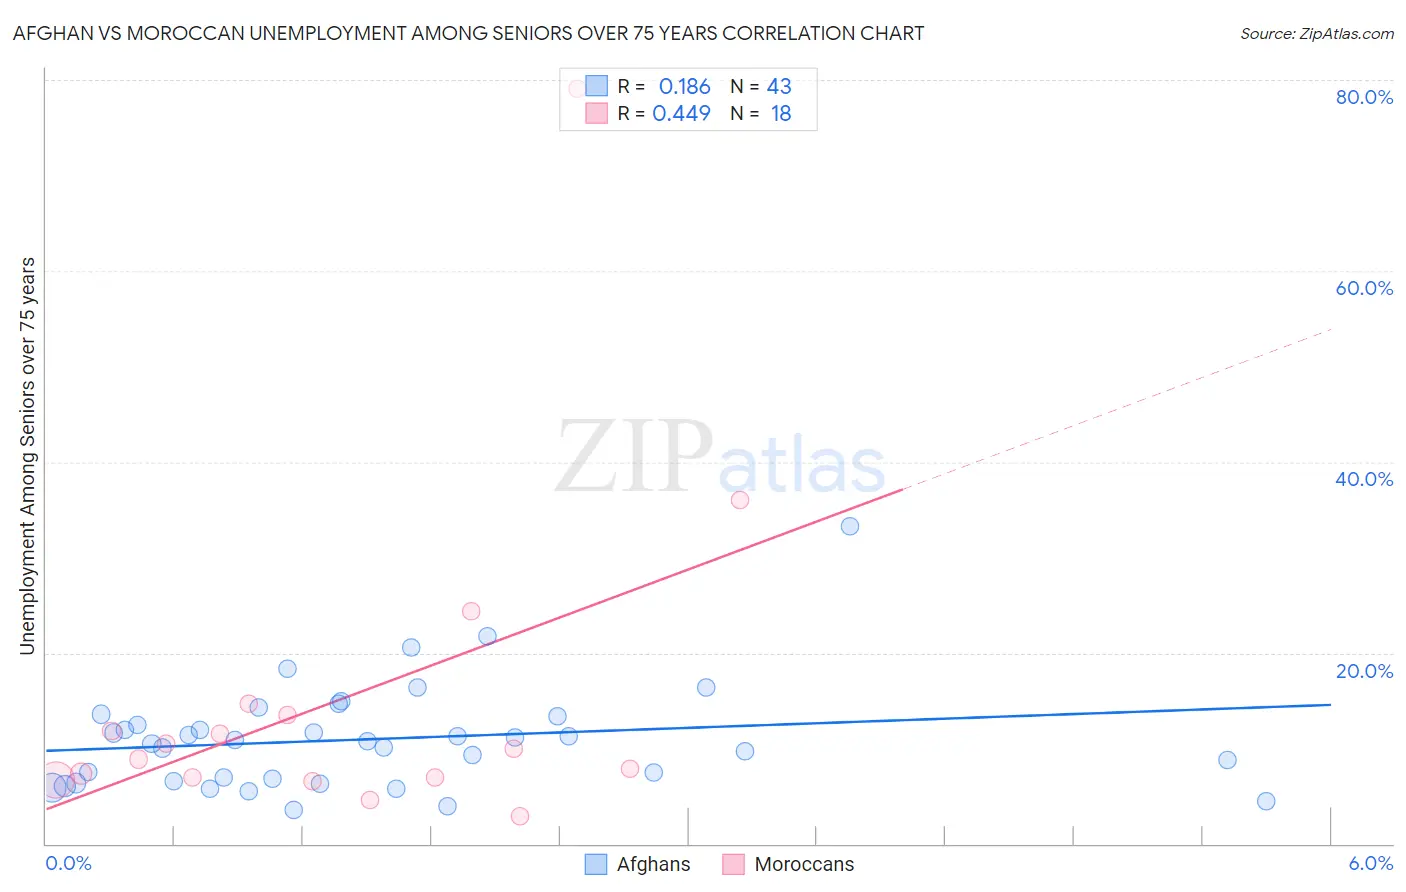
Afghan vs Moroccan Unemployment Among Seniors over 75 years Correlation Chart
The statistical analysis conducted on geographies consisting of 106,248,829 people shows a poor positive correlation between the proportion of Afghans and unemployment rate among seniors over the age of 75 in the United States with a correlation coefficient (R) of 0.186 and weighted average of 9.0%. Similarly, the statistical analysis conducted on geographies consisting of 131,616,504 people shows a moderate positive correlation between the proportion of Moroccans and unemployment rate among seniors over the age of 75 in the United States with a correlation coefficient (R) of 0.449 and weighted average of 7.8%, a difference of 15.3%.
Unemployment Among Seniors over 75 years Correlation Summary
| Measurement | Afghan | Moroccan |
| Minimum | 3.6% | 2.9% |
| Maximum | 33.3% | 79.1% |
| Range | 29.7% | 76.2% |
| Mean | 10.9% | 15.0% |
| Median | 10.7% | 9.4% |
| Interquartile 25% (IQ1) | 6.6% | 6.9% |
| Interquartile 75% (IQ3) | 13.3% | 13.4% |
| Interquartile Range (IQR) | 6.7% | 6.5% |
| Standard Deviation (Sample) | 5.5% | 17.8% |
| Standard Deviation (Population) | 5.5% | 17.3% |
Similar Demographics by Unemployment Among Seniors over 75 years
Demographics Similar to Afghans by Unemployment Among Seniors over 75 years
In terms of unemployment among seniors over 75 years, the demographic groups most similar to Afghans are Immigrants from Zimbabwe (9.0%, a difference of 0.080%), Guamanian/Chamorro (9.0%, a difference of 0.10%), Peruvian (9.0%, a difference of 0.18%), Immigrants from Africa (9.0%, a difference of 0.23%), and Immigrants from Jordan (9.0%, a difference of 0.24%).
| Demographics | Rating | Rank | Unemployment Among Seniors over 75 years |
| Romanians | 13.8 /100 | #212 | Poor 9.0% |
| Immigrants | Latin America | 13.4 /100 | #213 | Poor 9.0% |
| Immigrants | Brazil | 13.3 /100 | #214 | Poor 9.0% |
| Immigrants | Western Asia | 12.5 /100 | #215 | Poor 9.0% |
| Immigrants | Oceania | 11.8 /100 | #216 | Poor 9.0% |
| Lebanese | 11.1 /100 | #217 | Poor 9.0% |
| Immigrants | Africa | 9.7 /100 | #218 | Tragic 9.0% |
| Afghans | 8.3 /100 | #219 | Tragic 9.0% |
| Immigrants | Zimbabwe | 7.8 /100 | #220 | Tragic 9.0% |
| Guamanians/Chamorros | 7.7 /100 | #221 | Tragic 9.0% |
| Peruvians | 7.3 /100 | #222 | Tragic 9.0% |
| Immigrants | Jordan | 6.9 /100 | #223 | Tragic 9.0% |
| Costa Ricans | 6.3 /100 | #224 | Tragic 9.1% |
| Navajo | 6.1 /100 | #225 | Tragic 9.1% |
| Immigrants | Bangladesh | 5.9 /100 | #226 | Tragic 9.1% |
Demographics Similar to Moroccans by Unemployment Among Seniors over 75 years
In terms of unemployment among seniors over 75 years, the demographic groups most similar to Moroccans are Immigrants from Latvia (7.8%, a difference of 0.050%), Potawatomi (7.8%, a difference of 0.080%), Immigrants from Chile (7.8%, a difference of 0.11%), Bahamian (7.8%, a difference of 0.24%), and Immigrants from Egypt (7.9%, a difference of 0.31%).
| Demographics | Rating | Rank | Unemployment Among Seniors over 75 years |
| Immigrants | Spain | 100.0 /100 | #44 | Exceptional 7.8% |
| British West Indians | 100.0 /100 | #45 | Exceptional 7.8% |
| Immigrants | China | 100.0 /100 | #46 | Exceptional 7.8% |
| Creek | 100.0 /100 | #47 | Exceptional 7.8% |
| Immigrants | Chile | 100.0 /100 | #48 | Exceptional 7.8% |
| Potawatomi | 100.0 /100 | #49 | Exceptional 7.8% |
| Immigrants | Latvia | 100.0 /100 | #50 | Exceptional 7.8% |
| Moroccans | 100.0 /100 | #51 | Exceptional 7.8% |
| Bahamians | 100.0 /100 | #52 | Exceptional 7.8% |
| Immigrants | Egypt | 100.0 /100 | #53 | Exceptional 7.9% |
| Immigrants | Malaysia | 99.9 /100 | #54 | Exceptional 7.9% |
| Filipinos | 99.9 /100 | #55 | Exceptional 7.9% |
| Immigrants | Eastern Asia | 99.9 /100 | #56 | Exceptional 7.9% |
| Ottawa | 99.9 /100 | #57 | Exceptional 7.9% |
| Iranians | 99.9 /100 | #58 | Exceptional 7.9% |