Immigrants from Dominican Republic vs Immigrants from Zimbabwe Unemployment Among Ages 25 to 29 years
COMPARE
Immigrants from Dominican Republic
Immigrants from Zimbabwe
Unemployment Among Ages 25 to 29 years
Unemployment Among Ages 25 to 29 years Comparison
Immigrants from Dominican Republic
Immigrants from Zimbabwe
8.6%
UNEMPLOYMENT AMONG AGES 25 TO 29 YEARS
0.0/ 100
METRIC RATING
321st/ 347
METRIC RANK
6.1%
UNEMPLOYMENT AMONG AGES 25 TO 29 YEARS
99.5/ 100
METRIC RATING
35th/ 347
METRIC RANK
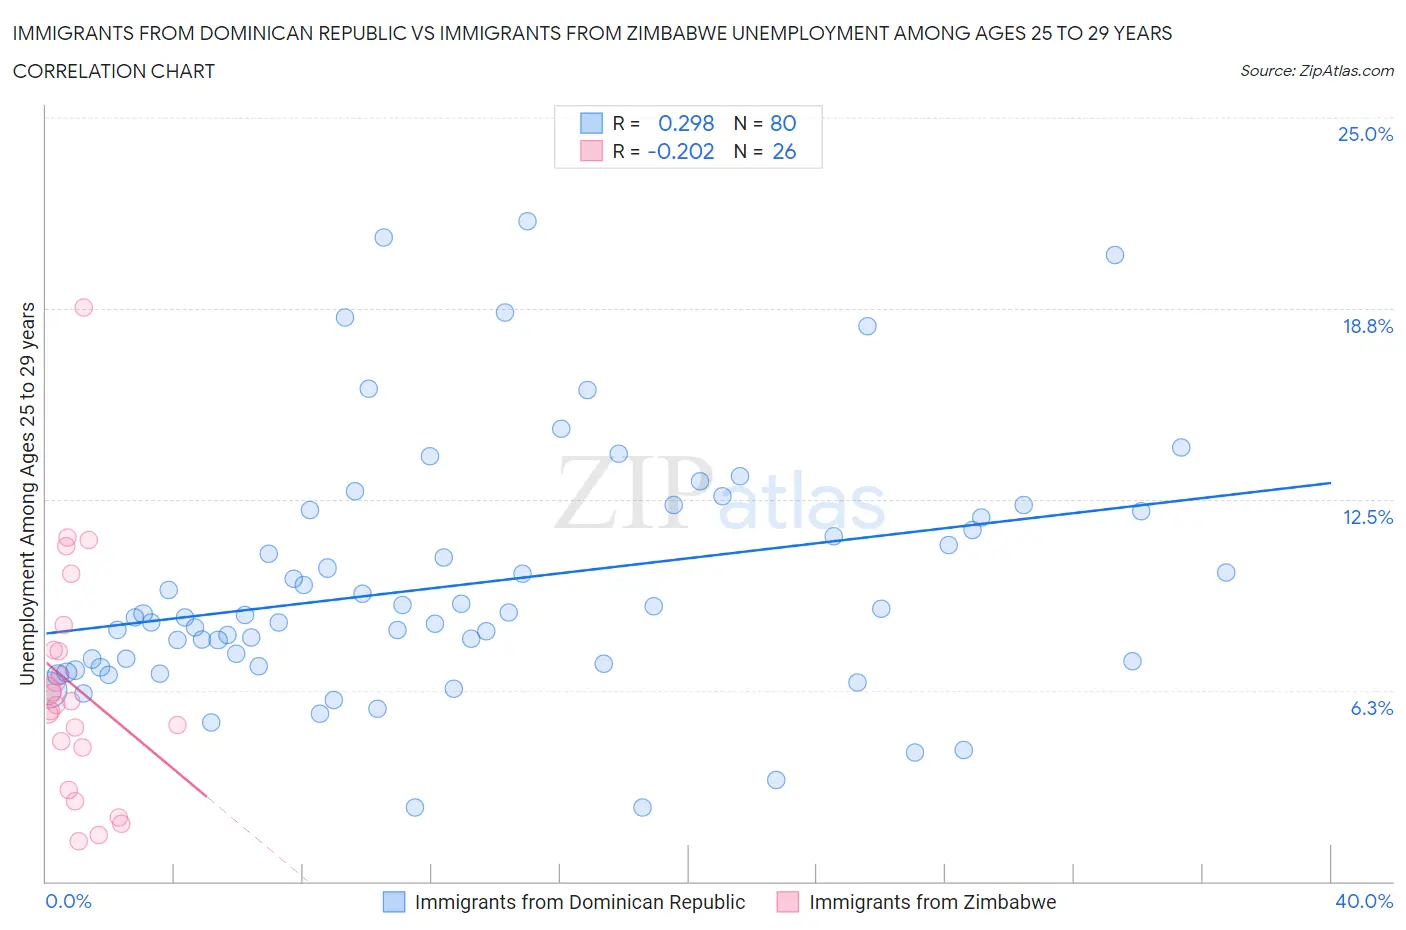
Immigrants from Dominican Republic vs Immigrants from Zimbabwe Unemployment Among Ages 25 to 29 years Correlation Chart
The statistical analysis conducted on geographies consisting of 264,956,049 people shows a weak positive correlation between the proportion of Immigrants from Dominican Republic and unemployment rate among population between the ages 25 and 29 in the United States with a correlation coefficient (R) of 0.298 and weighted average of 8.6%. Similarly, the statistical analysis conducted on geographies consisting of 116,035,324 people shows a weak negative correlation between the proportion of Immigrants from Zimbabwe and unemployment rate among population between the ages 25 and 29 in the United States with a correlation coefficient (R) of -0.202 and weighted average of 6.1%, a difference of 40.9%.
Unemployment Among Ages 25 to 29 years Correlation Summary
| Measurement | Immigrants from Dominican Republic | Immigrants from Zimbabwe |
| Minimum | 2.4% | 1.3% |
| Maximum | 21.6% | 18.8% |
| Range | 19.2% | 17.5% |
| Mean | 9.7% | 6.4% |
| Median | 8.7% | 5.8% |
| Interquartile 25% (IQ1) | 7.1% | 4.4% |
| Interquartile 75% (IQ3) | 12.0% | 7.6% |
| Interquartile Range (IQR) | 4.9% | 3.2% |
| Standard Deviation (Sample) | 4.1% | 3.8% |
| Standard Deviation (Population) | 4.0% | 3.8% |
Similar Demographics by Unemployment Among Ages 25 to 29 years
Demographics Similar to Immigrants from Dominican Republic by Unemployment Among Ages 25 to 29 years
In terms of unemployment among ages 25 to 29 years, the demographic groups most similar to Immigrants from Dominican Republic are Black/African American (8.6%, a difference of 0.61%), Tlingit-Haida (8.7%, a difference of 0.78%), Dominican (8.7%, a difference of 0.88%), Houma (8.7%, a difference of 1.2%), and Immigrants from Armenia (8.5%, a difference of 1.4%).
| Demographics | Rating | Rank | Unemployment Among Ages 25 to 29 years |
| Immigrants | Dominica | 0.0 /100 | #314 | Tragic 8.4% |
| British West Indians | 0.0 /100 | #315 | Tragic 8.4% |
| Immigrants | Grenada | 0.0 /100 | #316 | Tragic 8.4% |
| Immigrants | Guyana | 0.0 /100 | #317 | Tragic 8.5% |
| Guyanese | 0.0 /100 | #318 | Tragic 8.5% |
| Immigrants | Armenia | 0.0 /100 | #319 | Tragic 8.5% |
| Blacks/African Americans | 0.0 /100 | #320 | Tragic 8.6% |
| Immigrants | Dominican Republic | 0.0 /100 | #321 | Tragic 8.6% |
| Tlingit-Haida | 0.0 /100 | #322 | Tragic 8.7% |
| Dominicans | 0.0 /100 | #323 | Tragic 8.7% |
| Houma | 0.0 /100 | #324 | Tragic 8.7% |
| Yakama | 0.0 /100 | #325 | Tragic 8.8% |
| Shoshone | 0.0 /100 | #326 | Tragic 9.2% |
| Colville | 0.0 /100 | #327 | Tragic 9.2% |
| Apache | 0.0 /100 | #328 | Tragic 9.5% |
Demographics Similar to Immigrants from Zimbabwe by Unemployment Among Ages 25 to 29 years
In terms of unemployment among ages 25 to 29 years, the demographic groups most similar to Immigrants from Zimbabwe are Taiwanese (6.1%, a difference of 0.020%), Immigrants from Morocco (6.1%, a difference of 0.040%), Immigrants from Serbia (6.1%, a difference of 0.070%), Ethiopian (6.1%, a difference of 0.21%), and Yugoslavian (6.1%, a difference of 0.30%).
| Demographics | Rating | Rank | Unemployment Among Ages 25 to 29 years |
| Danes | 99.7 /100 | #28 | Exceptional 6.0% |
| Immigrants | South Central Asia | 99.7 /100 | #29 | Exceptional 6.1% |
| Bulgarians | 99.7 /100 | #30 | Exceptional 6.1% |
| Filipinos | 99.7 /100 | #31 | Exceptional 6.1% |
| Chinese | 99.6 /100 | #32 | Exceptional 6.1% |
| Yugoslavians | 99.6 /100 | #33 | Exceptional 6.1% |
| Immigrants | Morocco | 99.5 /100 | #34 | Exceptional 6.1% |
| Immigrants | Zimbabwe | 99.5 /100 | #35 | Exceptional 6.1% |
| Taiwanese | 99.5 /100 | #36 | Exceptional 6.1% |
| Immigrants | Serbia | 99.5 /100 | #37 | Exceptional 6.1% |
| Ethiopians | 99.4 /100 | #38 | Exceptional 6.1% |
| Indonesians | 99.3 /100 | #39 | Exceptional 6.1% |
| Immigrants | Kenya | 99.3 /100 | #40 | Exceptional 6.1% |
| Fijians | 99.3 /100 | #41 | Exceptional 6.1% |
| Jordanians | 99.3 /100 | #42 | Exceptional 6.1% |