Zimbabwean vs Immigrants from Iran Child Poverty Among Girls Under 16
COMPARE
Zimbabwean
Immigrants from Iran
Child Poverty Among Girls Under 16
Child Poverty Among Girls Under 16 Comparison
Zimbabweans
Immigrants from Iran
14.4%
CHILD POVERTY AMONG GIRLS UNDER 16
98.8/ 100
METRIC RATING
59th/ 347
METRIC RANK
12.6%
CHILD POVERTY AMONG GIRLS UNDER 16
100.0/ 100
METRIC RATING
10th/ 347
METRIC RANK
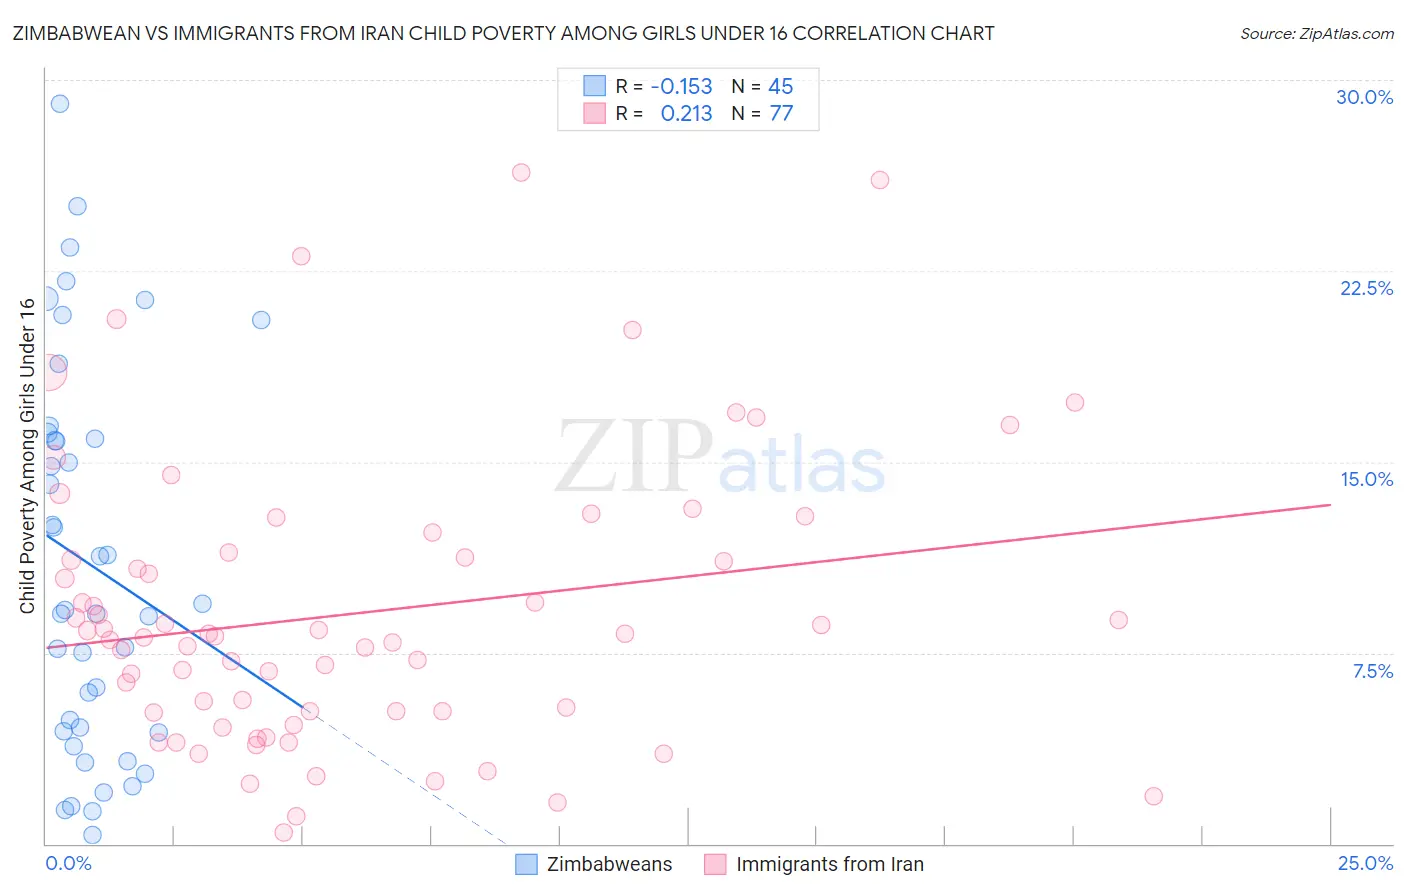
Zimbabwean vs Immigrants from Iran Child Poverty Among Girls Under 16 Correlation Chart
The statistical analysis conducted on geographies consisting of 69,044,520 people shows a poor negative correlation between the proportion of Zimbabweans and poverty level among girls under the age of 16 in the United States with a correlation coefficient (R) of -0.153 and weighted average of 14.4%. Similarly, the statistical analysis conducted on geographies consisting of 275,647,005 people shows a weak positive correlation between the proportion of Immigrants from Iran and poverty level among girls under the age of 16 in the United States with a correlation coefficient (R) of 0.213 and weighted average of 12.6%, a difference of 14.3%.
Child Poverty Among Girls Under 16 Correlation Summary
| Measurement | Zimbabwean | Immigrants from Iran |
| Minimum | 0.32% | 0.46% |
| Maximum | 29.1% | 26.3% |
| Range | 28.8% | 25.9% |
| Mean | 11.0% | 9.0% |
| Median | 9.2% | 8.2% |
| Interquartile 25% (IQ1) | 4.4% | 5.2% |
| Interquartile 75% (IQ3) | 16.0% | 11.3% |
| Interquartile Range (IQR) | 11.7% | 6.2% |
| Standard Deviation (Sample) | 7.5% | 5.6% |
| Standard Deviation (Population) | 7.4% | 5.6% |
Similar Demographics by Child Poverty Among Girls Under 16
Demographics Similar to Zimbabweans by Child Poverty Among Girls Under 16
In terms of child poverty among girls under 16, the demographic groups most similar to Zimbabweans are Immigrants from Bulgaria (14.4%, a difference of 0.060%), Immigrants from Serbia (14.4%, a difference of 0.15%), Immigrants from Indonesia (14.4%, a difference of 0.19%), Polish (14.4%, a difference of 0.19%), and Cambodian (14.4%, a difference of 0.20%).
| Demographics | Rating | Rank | Child Poverty Among Girls Under 16 |
| Italians | 99.1 /100 | #52 | Exceptional 14.3% |
| Luxembourgers | 99.0 /100 | #53 | Exceptional 14.3% |
| Estonians | 98.9 /100 | #54 | Exceptional 14.3% |
| Immigrants | Romania | 98.9 /100 | #55 | Exceptional 14.3% |
| Immigrants | Indonesia | 98.9 /100 | #56 | Exceptional 14.4% |
| Immigrants | Serbia | 98.9 /100 | #57 | Exceptional 14.4% |
| Immigrants | Bulgaria | 98.8 /100 | #58 | Exceptional 14.4% |
| Zimbabweans | 98.8 /100 | #59 | Exceptional 14.4% |
| Poles | 98.7 /100 | #60 | Exceptional 14.4% |
| Cambodians | 98.7 /100 | #61 | Exceptional 14.4% |
| Scandinavians | 98.7 /100 | #62 | Exceptional 14.4% |
| Immigrants | Europe | 98.7 /100 | #63 | Exceptional 14.4% |
| Immigrants | Philippines | 98.6 /100 | #64 | Exceptional 14.4% |
| Immigrants | Sweden | 98.6 /100 | #65 | Exceptional 14.5% |
| Immigrants | Belgium | 98.5 /100 | #66 | Exceptional 14.5% |
Demographics Similar to Immigrants from Iran by Child Poverty Among Girls Under 16
In terms of child poverty among girls under 16, the demographic groups most similar to Immigrants from Iran are Immigrants from Singapore (12.5%, a difference of 0.94%), Immigrants from South Central Asia (12.7%, a difference of 1.3%), Bhutanese (12.7%, a difference of 1.3%), Iranian (12.4%, a difference of 1.4%), and Chinese (12.3%, a difference of 1.9%).
| Demographics | Rating | Rank | Child Poverty Among Girls Under 16 |
| Filipinos | 100.0 /100 | #3 | Exceptional 11.4% |
| Tsimshian | 100.0 /100 | #4 | Exceptional 11.5% |
| Thais | 100.0 /100 | #5 | Exceptional 11.8% |
| Immigrants | Hong Kong | 100.0 /100 | #6 | Exceptional 12.3% |
| Chinese | 100.0 /100 | #7 | Exceptional 12.3% |
| Iranians | 100.0 /100 | #8 | Exceptional 12.4% |
| Immigrants | Singapore | 100.0 /100 | #9 | Exceptional 12.5% |
| Immigrants | Iran | 100.0 /100 | #10 | Exceptional 12.6% |
| Immigrants | South Central Asia | 100.0 /100 | #11 | Exceptional 12.7% |
| Bhutanese | 100.0 /100 | #12 | Exceptional 12.7% |
| Immigrants | Ireland | 99.9 /100 | #13 | Exceptional 12.9% |
| Burmese | 99.9 /100 | #14 | Exceptional 13.0% |
| Okinawans | 99.9 /100 | #15 | Exceptional 13.0% |
| Immigrants | Lithuania | 99.9 /100 | #16 | Exceptional 13.1% |
| Bulgarians | 99.9 /100 | #17 | Exceptional 13.1% |