Yuman vs Immigrants from Malaysia Family Poverty
COMPARE
Yuman
Immigrants from Malaysia
Family Poverty
Family Poverty Comparison
Yuman
Immigrants from Malaysia
16.6%
FAMILY POVERTY
0.0/ 100
METRIC RATING
339th/ 347
METRIC RANK
8.5%
FAMILY POVERTY
86.5/ 100
METRIC RATING
135th/ 347
METRIC RANK
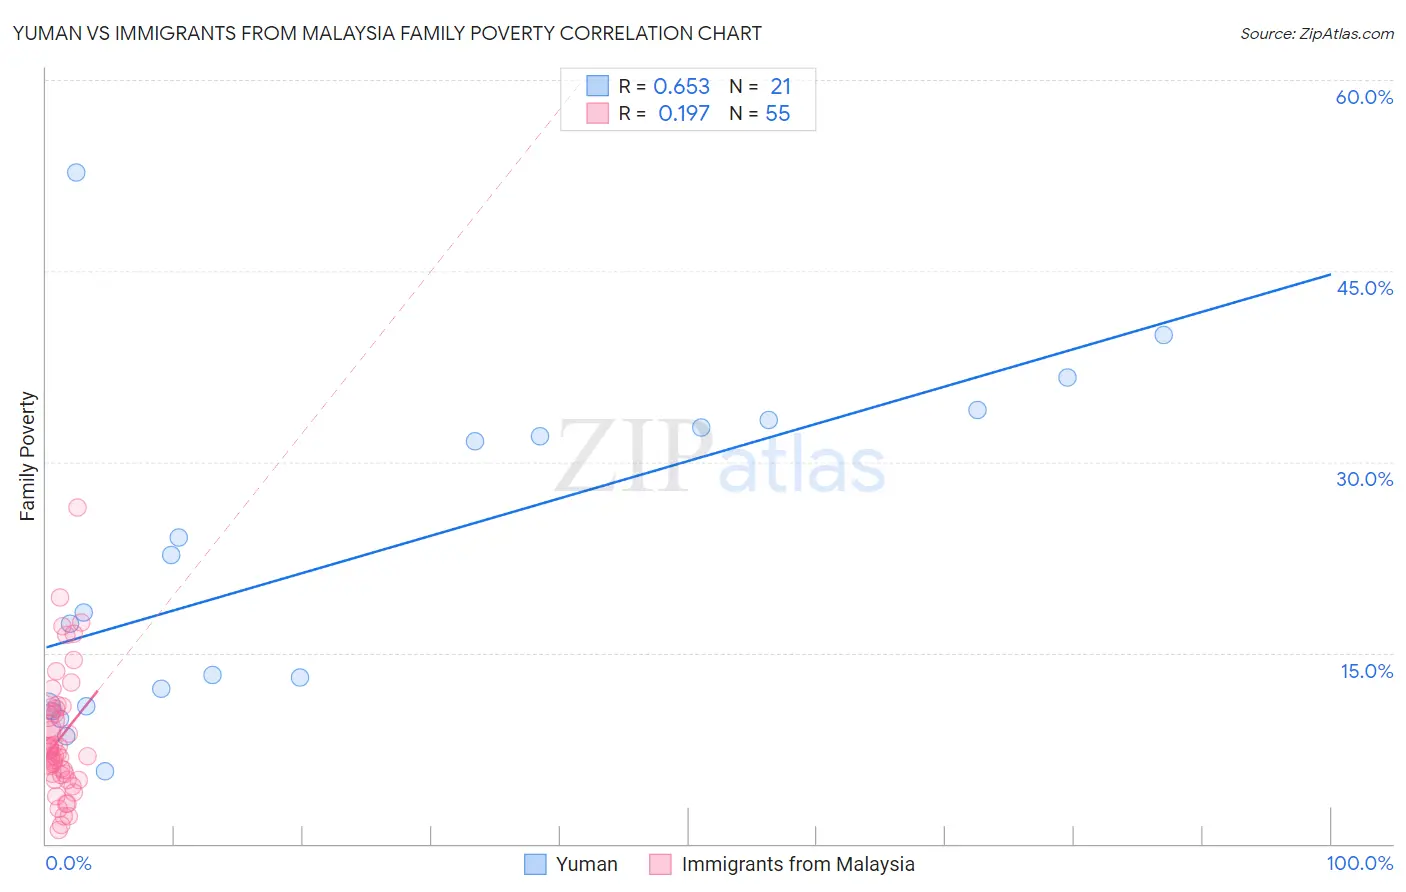
Yuman vs Immigrants from Malaysia Family Poverty Correlation Chart
The statistical analysis conducted on geographies consisting of 40,648,846 people shows a significant positive correlation between the proportion of Yuman and poverty level among families in the United States with a correlation coefficient (R) of 0.653 and weighted average of 16.6%. Similarly, the statistical analysis conducted on geographies consisting of 197,782,180 people shows a poor positive correlation between the proportion of Immigrants from Malaysia and poverty level among families in the United States with a correlation coefficient (R) of 0.197 and weighted average of 8.5%, a difference of 96.7%.
Family Poverty Correlation Summary
| Measurement | Yuman | Immigrants from Malaysia |
| Minimum | 5.7% | 1.1% |
| Maximum | 52.7% | 26.4% |
| Range | 47.0% | 25.3% |
| Mean | 22.4% | 8.3% |
| Median | 18.2% | 7.1% |
| Interquartile 25% (IQ1) | 10.8% | 5.4% |
| Interquartile 75% (IQ3) | 33.0% | 10.6% |
| Interquartile Range (IQR) | 22.2% | 5.2% |
| Standard Deviation (Sample) | 12.9% | 4.9% |
| Standard Deviation (Population) | 12.6% | 4.8% |
Similar Demographics by Family Poverty
Demographics Similar to Yuman by Family Poverty
In terms of family poverty, the demographic groups most similar to Yuman are Pueblo (17.0%, a difference of 2.1%), Lumbee (17.0%, a difference of 2.1%), Crow (16.1%, a difference of 3.3%), Hopi (15.9%, a difference of 4.5%), and Sioux (15.9%, a difference of 5.0%).
| Demographics | Rating | Rank | Family Poverty |
| Dominicans | 0.0 /100 | #332 | Tragic 14.3% |
| Immigrants | Dominican Republic | 0.0 /100 | #333 | Tragic 14.4% |
| Houma | 0.0 /100 | #334 | Tragic 14.6% |
| Apache | 0.0 /100 | #335 | Tragic 14.7% |
| Sioux | 0.0 /100 | #336 | Tragic 15.9% |
| Hopi | 0.0 /100 | #337 | Tragic 15.9% |
| Crow | 0.0 /100 | #338 | Tragic 16.1% |
| Yuman | 0.0 /100 | #339 | Tragic 16.6% |
| Pueblo | 0.0 /100 | #340 | Tragic 17.0% |
| Lumbee | 0.0 /100 | #341 | Tragic 17.0% |
| Immigrants | Yemen | 0.0 /100 | #342 | Tragic 17.5% |
| Pima | 0.0 /100 | #343 | Tragic 18.4% |
| Yup'ik | 0.0 /100 | #344 | Tragic 18.7% |
| Navajo | 0.0 /100 | #345 | Tragic 18.8% |
| Puerto Ricans | 0.0 /100 | #346 | Tragic 20.3% |
Demographics Similar to Immigrants from Malaysia by Family Poverty
In terms of family poverty, the demographic groups most similar to Immigrants from Malaysia are Chilean (8.5%, a difference of 0.040%), Immigrants from Brazil (8.5%, a difference of 0.040%), Sri Lankan (8.5%, a difference of 0.050%), Immigrants from Southern Europe (8.5%, a difference of 0.12%), and Armenian (8.5%, a difference of 0.52%).
| Demographics | Rating | Rank | Family Poverty |
| Argentineans | 89.6 /100 | #128 | Excellent 8.4% |
| Portuguese | 89.2 /100 | #129 | Excellent 8.4% |
| Immigrants | Bosnia and Herzegovina | 88.6 /100 | #130 | Excellent 8.4% |
| Puget Sound Salish | 88.6 /100 | #131 | Excellent 8.4% |
| Immigrants | Argentina | 88.2 /100 | #132 | Excellent 8.4% |
| Sri Lankans | 86.6 /100 | #133 | Excellent 8.5% |
| Chileans | 86.6 /100 | #134 | Excellent 8.5% |
| Immigrants | Malaysia | 86.5 /100 | #135 | Excellent 8.5% |
| Immigrants | Brazil | 86.3 /100 | #136 | Excellent 8.5% |
| Immigrants | Southern Europe | 86.0 /100 | #137 | Excellent 8.5% |
| Armenians | 84.6 /100 | #138 | Excellent 8.5% |
| Immigrants | Nepal | 84.2 /100 | #139 | Excellent 8.5% |
| Immigrants | Kazakhstan | 84.1 /100 | #140 | Excellent 8.5% |
| Immigrants | Ukraine | 83.9 /100 | #141 | Excellent 8.5% |
| Yugoslavians | 83.5 /100 | #142 | Excellent 8.5% |