Immigrants from Haiti vs Irish Family Poverty

COMPARE

Immigrants from Haiti
Race
Ancestry
AfghanAfricanAlaska NativeAlaskan AthabascanAlbanianAleutAlsatianAmericanApacheArabArapahoArgentineanArmenianAssyrian/Chaldean/SyriacAustralianAustrianBahamianBangladeshiBarbadianBasqueBelgianBelizeanBermudanBhutaneseBlackfeetBolivianBrazilianBritishBritish West IndianBulgarianBurmeseCajunCambodianCanadianCape VerdeanCarpatho RusynCelticCentral AmericanCentral American IndianCherokeeCheyenneChickasawChileanChineseChippewaChoctawColombianColvilleComancheCosta RicanCreeCreekCroatianCrowCubanCypriotCzechCzechoslovakianDanishDelawareDominicanDutchDutch West IndianEastern EuropeanEcuadorianEgyptianEnglishEstonianEthiopianEuropeanFijianFilipinoFinnishFrenchFrench American IndianFrench CanadianGermanGerman RussianGhanaianGreekGuamanian/ChamorroGuatemalanGuyaneseHaitianHmongHonduranHopiHoumaHungarianIcelanderIndian (Asian)IndonesianInupiatIranianIraqiIroquoisIsraeliItalianJamaicanJapaneseJordanianKenyanKiowaKoreanLaotianLatvianLebaneseLiberianLithuanianLumbeeLuxembourgerMacedonianMalaysianMalteseMarshalleseMenomineeMexicanMexican American IndianMongolianMoroccanNative HawaiianNavajoNepaleseNew ZealanderNicaraguanNigerianNorthern EuropeanNorwegianOkinawanOsageOttawaPaiutePakistaniPalestinianPanamanianParaguayanPennsylvania GermanPeruvianPimaPolishPortuguesePotawatomiPuebloPuerto RicanPuget Sound SalishRomanianRussianSalvadoranSamoanScandinavianScotch-IrishScottishSeminoleSenegaleseSerbianShoshoneSierra LeoneanSiouxSlavicSlovakSloveneSomaliSouth AfricanSouth AmericanSouth American IndianSoviet UnionSpaniardSpanishSpanish AmericanSpanish American IndianSri LankanSubsaharan AfricanSudaneseSwedishSwissSyrianTaiwaneseThaiTlingit-HaidaTohono O'OdhamTonganTrinidadian and TobagonianTsimshianTurkishU.S. Virgin IslanderUgandanUkrainianUruguayanUteVenezuelanVietnameseWelshWest IndianYakamaYaquiYugoslavianYumanYup'ikZimbabwean
Immigration
NonimmigrantsImmigrantsAfghanistanAfricaAlbaniaArgentinaArmeniaAsiaAustraliaAustriaBahamasBangladeshBarbadosBelarusBelgiumBelizeBoliviaBosnia and HerzegovinaBrazilBulgariaBurma/MyanmarCabo VerdeCambodiaCameroonCanadaCaribbeanCentral AmericaChileChinaColombiaCongoCosta RicaCroatiaCubaCzechoslovakiaDenmarkDominicaDominican RepublicEastern AfricaEastern AsiaEastern EuropeEcuadorEgyptEl SalvadorEnglandEritreaEthiopiaEuropeFijiFranceGermanyGhanaGreeceGrenadaGuatemalaGuyanaHaitiHondurasHong KongHungaryIndiaIndonesiaIranIraqIrelandIsraelItalyJamaicaJapanJordanKazakhstanKenyaKoreaKuwaitLaosLatin AmericaLatviaLebanonLiberiaLithuaniaMalaysiaMexicoMicronesiaMiddle AfricaMoldovaMoroccoNepalNetherlandsNicaraguaNigeriaNorth AmericaNorth MacedoniaNorthern AfricaNorthern EuropeNorwayOceaniaPakistanPanamaPeruPhilippinesPolandPortugalRomaniaRussiaSaudi ArabiaScotlandSenegalSerbiaSierra LeoneSingaporeSomaliaSouth AfricaSouth AmericaSouth Central AsiaSouth Eastern AsiaSouthern EuropeSpainSri LankaSt. Vincent and the GrenadinesSudanSwedenSwitzerlandSyriaTaiwanThailandTrinidad and TobagoTurkeyUgandaUkraineUruguayUzbekistanVenezuelaVietnamWest IndiesWestern AfricaWestern AsiaWestern EuropeYemenZaireZimbabweAzores
Irish
Race
Ancestry
AfghanAfricanAlaska NativeAlaskan AthabascanAlbanianAleutAlsatianAmericanApacheArabArapahoArgentineanArmenianAssyrian/Chaldean/SyriacAustralianAustrianBahamianBangladeshiBarbadianBasqueBelgianBelizeanBermudanBhutaneseBlackfeetBolivianBrazilianBritishBritish West IndianBulgarianBurmeseCajunCambodianCanadianCape VerdeanCarpatho RusynCelticCentral AmericanCentral American IndianCherokeeCheyenneChickasawChileanChineseChippewaChoctawColombianColvilleComancheCosta RicanCreeCreekCroatianCrowCubanCypriotCzechCzechoslovakianDanishDelawareDominicanDutchDutch West IndianEastern EuropeanEcuadorianEgyptianEnglishEstonianEthiopianEuropeanFijianFilipinoFinnishFrenchFrench American IndianFrench CanadianGermanGerman RussianGhanaianGreekGuamanian/ChamorroGuatemalanGuyaneseHaitianHmongHonduranHopiHoumaHungarianIcelanderIndian (Asian)IndonesianInupiatIranianIraqiIrishIroquoisIsraeliItalianJamaicanJapaneseJordanianKenyanKiowaKoreanLaotianLatvianLebaneseLiberianLithuanianLumbeeLuxembourgerMacedonianMalaysianMalteseMarshalleseMenomineeMexicanMexican American IndianMongolianMoroccanNative HawaiianNavajoNepaleseNew ZealanderNicaraguanNigerianNorthern EuropeanNorwegianOkinawanOsageOttawaPaiutePakistaniPalestinianPanamanianParaguayanPennsylvania GermanPeruvianPimaPolishPortuguesePotawatomiPuebloPuerto RicanPuget Sound SalishRomanianRussianSalvadoranSamoanScandinavianScotch-IrishScottishSeminoleSenegaleseSerbianShoshoneSierra LeoneanSiouxSlavicSlovakSloveneSomaliSouth AfricanSouth AmericanSouth American IndianSoviet UnionSpaniardSpanishSpanish AmericanSpanish American IndianSri LankanSubsaharan AfricanSudaneseSwedishSwissSyrianTaiwaneseThaiTlingit-HaidaTohono O'OdhamTonganTrinidadian and TobagonianTsimshianTurkishU.S. Virgin IslanderUgandanUkrainianUruguayanUteVenezuelanVietnameseWelshWest IndianYakamaYaquiYugoslavianYumanYup'ikZimbabwean
Immigration
NonimmigrantsImmigrantsAfghanistanAfricaAlbaniaArgentinaArmeniaAsiaAustraliaAustriaBahamasBangladeshBarbadosBelarusBelgiumBelizeBoliviaBosnia and HerzegovinaBrazilBulgariaBurma/MyanmarCabo VerdeCambodiaCameroonCanadaCaribbeanCentral AmericaChileChinaColombiaCongoCosta RicaCroatiaCubaCzechoslovakiaDenmarkDominicaDominican RepublicEastern AfricaEastern AsiaEastern EuropeEcuadorEgyptEl SalvadorEnglandEritreaEthiopiaEuropeFijiFranceGermanyGhanaGreeceGrenadaGuatemalaGuyanaHondurasHong KongHungaryIndiaIndonesiaIranIraqIrelandIsraelItalyJamaicaJapanJordanKazakhstanKenyaKoreaKuwaitLaosLatin AmericaLatviaLebanonLiberiaLithuaniaMalaysiaMexicoMicronesiaMiddle AfricaMoldovaMoroccoNepalNetherlandsNicaraguaNigeriaNorth AmericaNorth MacedoniaNorthern AfricaNorthern EuropeNorwayOceaniaPakistanPanamaPeruPhilippinesPolandPortugalRomaniaRussiaSaudi ArabiaScotlandSenegalSerbiaSierra LeoneSingaporeSomaliaSouth AfricaSouth AmericaSouth Central AsiaSouth Eastern AsiaSouthern EuropeSpainSri LankaSt. Vincent and the GrenadinesSudanSwedenSwitzerlandSyriaTaiwanThailandTrinidad and TobagoTurkeyUgandaUkraineUruguayUzbekistanVenezuelaVietnamWest IndiesWestern AfricaWestern AsiaWestern EuropeYemenZaireZimbabweAzores
Family Poverty
Income
Poverty
Unemployment
Labor Participation
Family Structure
Vehicle Availability
Education Level
Disability

Family Poverty Comparison

Immigrants from Haiti

Irish

Tragic
Exceptional
11.6%
FAMILY POVERTY
0.0/ 100
METRIC RATING
295th/ 347
METRIC RANK
7.9%
FAMILY POVERTY
97.8/ 100
METRIC RATING
81st/ 347
METRIC RANK

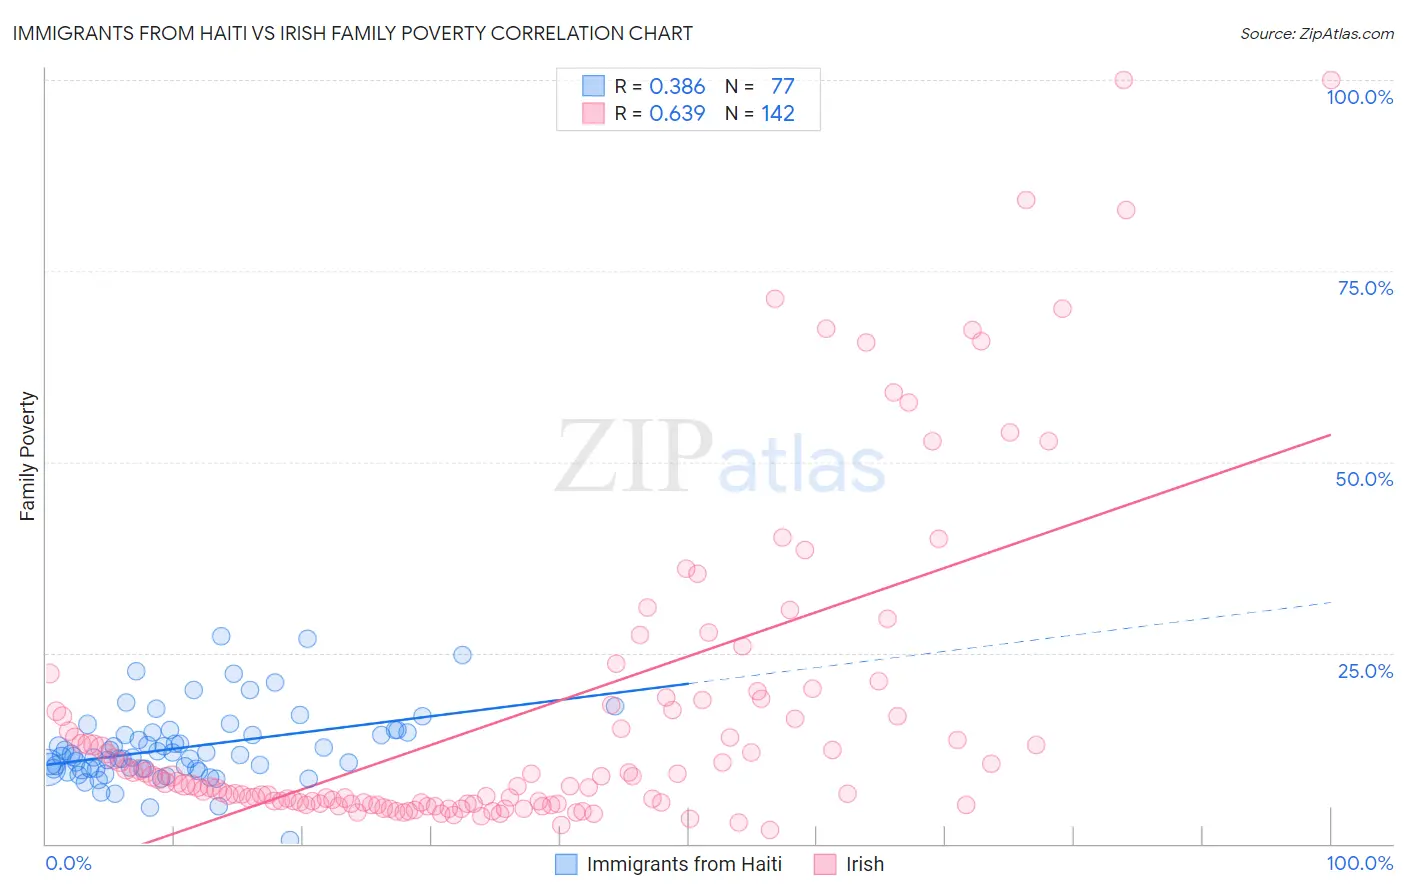
Immigrants from Haiti vs Irish Family Poverty Correlation Chart

The statistical analysis conducted on geographies consisting of 224,880,421 people shows a mild positive correlation between the proportion of Immigrants from Haiti and poverty level among families in the United States with a correlation coefficient (R) of 0.386 and weighted average of 11.6%. Similarly, the statistical analysis conducted on geographies consisting of 574,608,080 people shows a significant positive correlation between the proportion of Irish and poverty level among families in the United States with a correlation coefficient (R) of 0.639 and weighted average of 7.9%, a difference of 47.3%.
Immigrants from Haiti vs Irish Family Poverty

Family Poverty Correlation Summary

MeasurementImmigrants from HaitiIrish
Minimum0.50%1.7%
Maximum27.1%100.0%
Range26.6%98.3%
Mean12.6%16.9%
Median11.5%7.9%
Interquartile 25% (IQ1)9.8%5.2%
Interquartile 75% (IQ3)14.6%17.5%
Interquartile Range (IQR)4.8%12.2%
Standard Deviation (Sample)4.8%20.6%
Standard Deviation (Population)4.7%20.5%

Similar Demographics by Family Poverty

Demographics Similar to Immigrants from Haiti by Family Poverty

In terms of family poverty, the demographic groups most similar to Immigrants from Haiti are Choctaw (11.6%, a difference of 0.050%), Immigrants from St. Vincent and the Grenadines (11.6%, a difference of 0.12%), Immigrants from Cabo Verde (11.6%, a difference of 0.20%), Creek (11.7%, a difference of 0.28%), and Immigrants from Senegal (11.7%, a difference of 0.42%).
DemographicsRating | RankFamily Poverty
Immigrants | Belize
0.0
/100
|
#288
Tragic
11.5%
Immigrants | Barbados
0.0
/100
|
#289
Tragic
11.5%
West Indians
0.0
/100
|
#290
Tragic
11.5%
Haitians
0.0
/100
|
#291
Tragic
11.5%
Immigrants | Somalia
0.0
/100
|
#292
Tragic
11.5%
Immigrants | Cabo Verde
0.0
/100
|
#293
Tragic
11.6%
Immigrants | St. Vincent and the Grenadines
0.0
/100
|
#294
Tragic
11.6%
Immigrants | Haiti
0.0
/100
|
#295
Tragic
11.6%
Choctaw
0.0
/100
|
#296
Tragic
11.6%
Creek
0.0
/100
|
#297
Tragic
11.7%
Immigrants | Senegal
0.0
/100
|
#298
Tragic
11.7%
Dutch West Indians
0.0
/100
|
#299
Tragic
11.7%
Immigrants | Bangladesh
0.0
/100
|
#300
Tragic
11.7%
Bahamians
0.0
/100
|
#301
Tragic
11.7%
Guatemalans
0.0
/100
|
#302
Tragic
11.7%

Demographics Similar to Irish by Family Poverty

In terms of family poverty, the demographic groups most similar to Irish are English (7.9%, a difference of 0.010%), Immigrants from Poland (7.9%, a difference of 0.030%), Immigrants from Europe (7.9%, a difference of 0.070%), Immigrants from North America (7.9%, a difference of 0.15%), and Slovak (7.9%, a difference of 0.20%).
DemographicsRating | RankFamily Poverty
Immigrants | China
98.1
/100
|
#74
Exceptional
7.8%
Immigrants | Croatia
98.1
/100
|
#75
Exceptional
7.8%
Immigrants | Latvia
98.0
/100
|
#76
Exceptional
7.9%
Ukrainians
98.0
/100
|
#77
Exceptional
7.9%
Immigrants | North America
97.9
/100
|
#78
Exceptional
7.9%
Immigrants | Europe
97.8
/100
|
#79
Exceptional
7.9%
English
97.8
/100
|
#80
Exceptional
7.9%
Irish
97.8
/100
|
#81
Exceptional
7.9%
Immigrants | Poland
97.8
/100
|
#82
Exceptional
7.9%
Slovaks
97.7
/100
|
#83
Exceptional
7.9%
British
97.5
/100
|
#84
Exceptional
7.9%
Immigrants | Asia
97.4
/100
|
#85
Exceptional
7.9%
Scottish
97.3
/100
|
#86
Exceptional
7.9%
Belgians
97.3
/100
|
#87
Exceptional
8.0%
Serbians
97.2
/100
|
#88
Exceptional
8.0%