Immigrants from Lithuania vs Irish Family Poverty
COMPARE
Immigrants from Lithuania
Irish
Family Poverty
Family Poverty Comparison
Immigrants from Lithuania
Irish
7.2%
FAMILY POVERTY
99.8/ 100
METRIC RATING
18th/ 347
METRIC RANK
7.9%
FAMILY POVERTY
97.8/ 100
METRIC RATING
81st/ 347
METRIC RANK
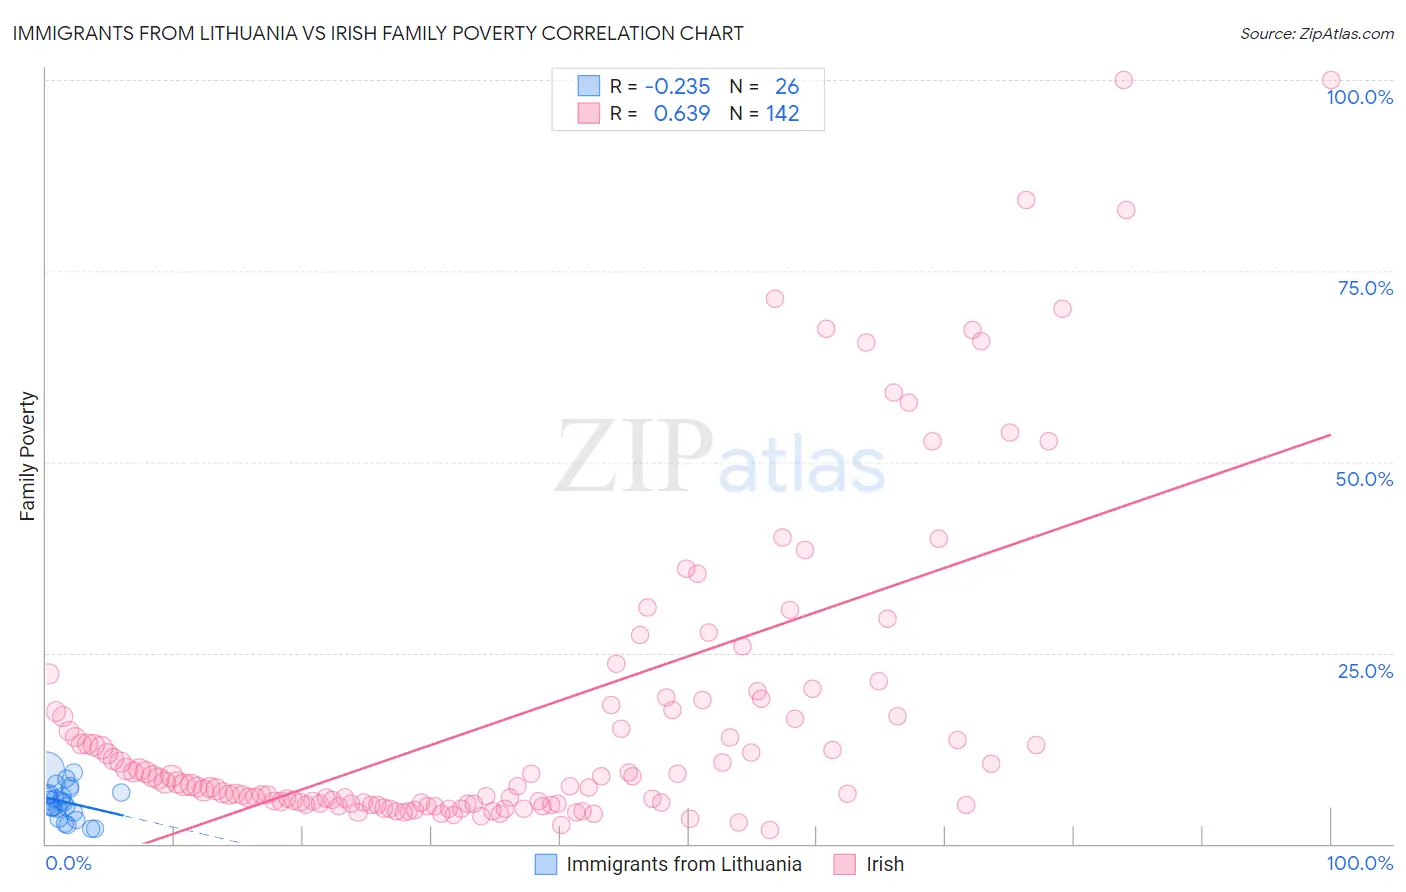
Immigrants from Lithuania vs Irish Family Poverty Correlation Chart
The statistical analysis conducted on geographies consisting of 117,605,958 people shows a weak negative correlation between the proportion of Immigrants from Lithuania and poverty level among families in the United States with a correlation coefficient (R) of -0.235 and weighted average of 7.2%. Similarly, the statistical analysis conducted on geographies consisting of 574,608,080 people shows a significant positive correlation between the proportion of Irish and poverty level among families in the United States with a correlation coefficient (R) of 0.639 and weighted average of 7.9%, a difference of 9.2%.
Family Poverty Correlation Summary
| Measurement | Immigrants from Lithuania | Irish |
| Minimum | 1.9% | 1.7% |
| Maximum | 9.7% | 100.0% |
| Range | 7.8% | 98.3% |
| Mean | 5.5% | 16.9% |
| Median | 5.5% | 7.9% |
| Interquartile 25% (IQ1) | 4.1% | 5.2% |
| Interquartile 75% (IQ3) | 6.7% | 17.5% |
| Interquartile Range (IQR) | 2.5% | 12.2% |
| Standard Deviation (Sample) | 2.2% | 20.6% |
| Standard Deviation (Population) | 2.1% | 20.5% |
Similar Demographics by Family Poverty
Demographics Similar to Immigrants from Lithuania by Family Poverty
In terms of family poverty, the demographic groups most similar to Immigrants from Lithuania are Luxembourger (7.2%, a difference of 0.010%), Immigrants from South Central Asia (7.2%, a difference of 0.24%), Eastern European (7.2%, a difference of 0.30%), Immigrants from Hong Kong (7.3%, a difference of 0.46%), and Lithuanian (7.2%, a difference of 0.51%).
| Demographics | Rating | Rank | Family Poverty |
| Immigrants | Singapore | 99.8 /100 | #11 | Exceptional 7.1% |
| Maltese | 99.8 /100 | #12 | Exceptional 7.1% |
| Swedes | 99.8 /100 | #13 | Exceptional 7.1% |
| Iranians | 99.8 /100 | #14 | Exceptional 7.1% |
| Lithuanians | 99.8 /100 | #15 | Exceptional 7.2% |
| Immigrants | South Central Asia | 99.8 /100 | #16 | Exceptional 7.2% |
| Luxembourgers | 99.8 /100 | #17 | Exceptional 7.2% |
| Immigrants | Lithuania | 99.8 /100 | #18 | Exceptional 7.2% |
| Eastern Europeans | 99.7 /100 | #19 | Exceptional 7.2% |
| Immigrants | Hong Kong | 99.7 /100 | #20 | Exceptional 7.3% |
| Immigrants | Iran | 99.7 /100 | #21 | Exceptional 7.3% |
| Danes | 99.7 /100 | #22 | Exceptional 7.3% |
| Assyrians/Chaldeans/Syriacs | 99.7 /100 | #23 | Exceptional 7.3% |
| Croatians | 99.7 /100 | #24 | Exceptional 7.3% |
| Burmese | 99.7 /100 | #25 | Exceptional 7.3% |
Demographics Similar to Irish by Family Poverty
In terms of family poverty, the demographic groups most similar to Irish are English (7.9%, a difference of 0.010%), Immigrants from Poland (7.9%, a difference of 0.030%), Immigrants from Europe (7.9%, a difference of 0.070%), Immigrants from North America (7.9%, a difference of 0.15%), and Slovak (7.9%, a difference of 0.20%).
| Demographics | Rating | Rank | Family Poverty |
| Immigrants | China | 98.1 /100 | #74 | Exceptional 7.8% |
| Immigrants | Croatia | 98.1 /100 | #75 | Exceptional 7.8% |
| Immigrants | Latvia | 98.0 /100 | #76 | Exceptional 7.9% |
| Ukrainians | 98.0 /100 | #77 | Exceptional 7.9% |
| Immigrants | North America | 97.9 /100 | #78 | Exceptional 7.9% |
| Immigrants | Europe | 97.8 /100 | #79 | Exceptional 7.9% |
| English | 97.8 /100 | #80 | Exceptional 7.9% |
| Irish | 97.8 /100 | #81 | Exceptional 7.9% |
| Immigrants | Poland | 97.8 /100 | #82 | Exceptional 7.9% |
| Slovaks | 97.7 /100 | #83 | Exceptional 7.9% |
| British | 97.5 /100 | #84 | Exceptional 7.9% |
| Immigrants | Asia | 97.4 /100 | #85 | Exceptional 7.9% |
| Scottish | 97.3 /100 | #86 | Exceptional 7.9% |
| Belgians | 97.3 /100 | #87 | Exceptional 8.0% |
| Serbians | 97.2 /100 | #88 | Exceptional 8.0% |