White/Caucasian vs Immigrants from Bahamas Child Poverty Under the Age of 5
COMPARE
White/Caucasian
Immigrants from Bahamas
Child Poverty Under the Age of 5
Child Poverty Under the Age of 5 Comparison
Whites/Caucasians
Immigrants from Bahamas
18.1%
CHILD POVERTY UNDER THE AGE OF 5
12.6/ 100
METRIC RATING
206th/ 347
METRIC RANK
22.7%
CHILD POVERTY UNDER THE AGE OF 5
0.0/ 100
METRIC RATING
307th/ 347
METRIC RANK
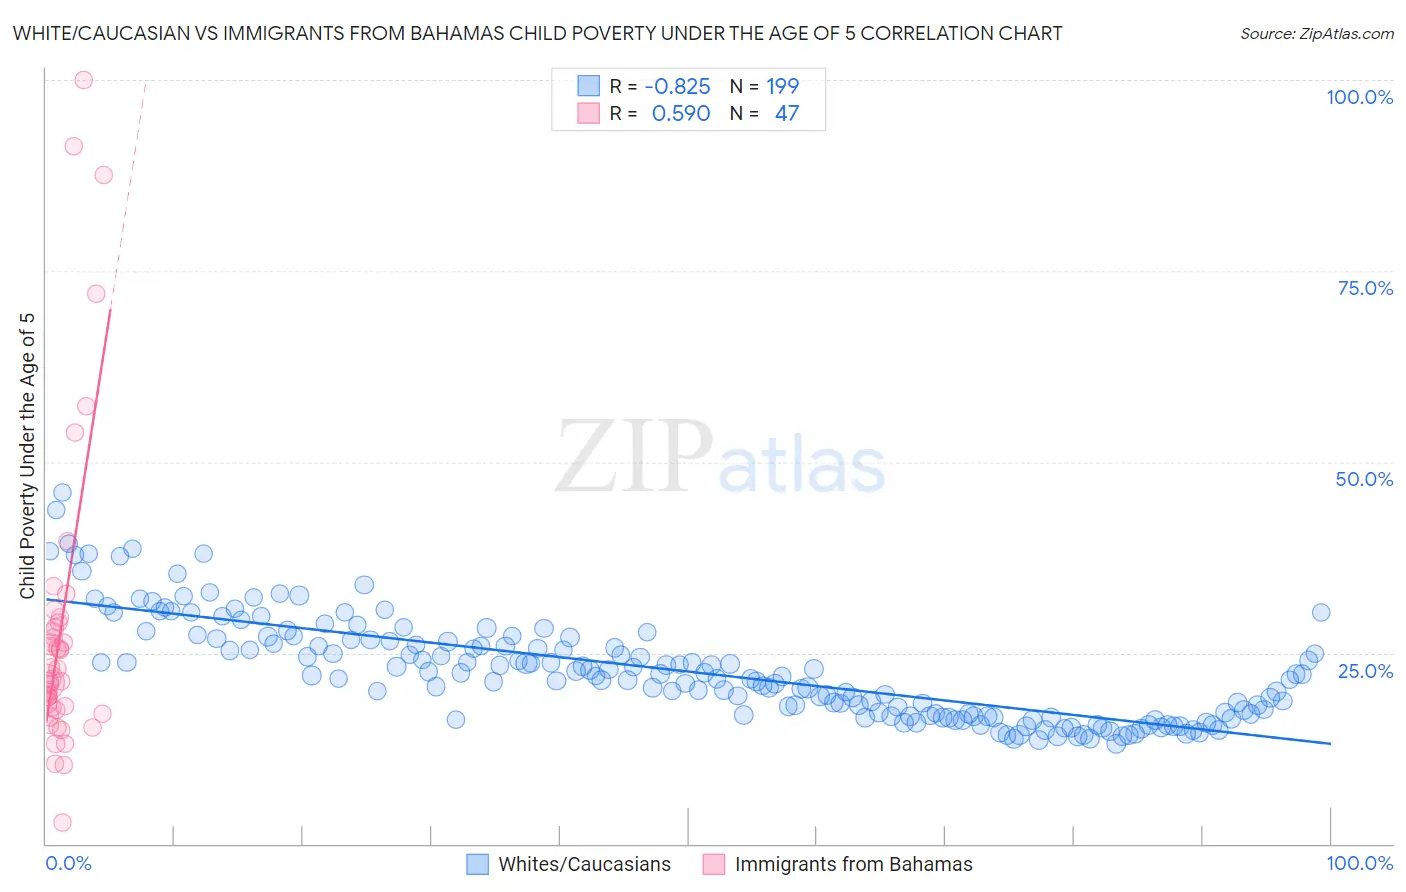
White/Caucasian vs Immigrants from Bahamas Child Poverty Under the Age of 5 Correlation Chart
The statistical analysis conducted on geographies consisting of 539,824,929 people shows a very strong negative correlation between the proportion of Whites/Caucasians and poverty level among children under the age of 5 in the United States with a correlation coefficient (R) of -0.825 and weighted average of 18.1%. Similarly, the statistical analysis conducted on geographies consisting of 103,726,631 people shows a substantial positive correlation between the proportion of Immigrants from Bahamas and poverty level among children under the age of 5 in the United States with a correlation coefficient (R) of 0.590 and weighted average of 22.7%, a difference of 25.3%.
Child Poverty Under the Age of 5 Correlation Summary
| Measurement | White/Caucasian | Immigrants from Bahamas |
| Minimum | 13.1% | 2.7% |
| Maximum | 46.1% | 100.0% |
| Range | 32.9% | 97.3% |
| Mean | 22.6% | 28.6% |
| Median | 21.9% | 21.6% |
| Interquartile 25% (IQ1) | 16.7% | 17.5% |
| Interquartile 75% (IQ3) | 26.5% | 29.0% |
| Interquartile Range (IQR) | 9.8% | 11.5% |
| Standard Deviation (Sample) | 6.6% | 20.8% |
| Standard Deviation (Population) | 6.6% | 20.6% |
Similar Demographics by Child Poverty Under the Age of 5
Demographics Similar to Whites/Caucasians by Child Poverty Under the Age of 5
In terms of child poverty under the age of 5, the demographic groups most similar to Whites/Caucasians are Spaniard (18.1%, a difference of 0.060%), Immigrants from Eastern Africa (18.1%, a difference of 0.19%), Immigrants from Cambodia (18.1%, a difference of 0.25%), Japanese (18.1%, a difference of 0.27%), and Ugandan (18.0%, a difference of 0.29%).
| Demographics | Rating | Rank | Child Poverty Under the Age of 5 |
| Hungarians | 18.3 /100 | #199 | Poor 17.9% |
| Iraqis | 14.0 /100 | #200 | Poor 18.0% |
| Ugandans | 13.9 /100 | #201 | Poor 18.0% |
| Japanese | 13.8 /100 | #202 | Poor 18.1% |
| Immigrants | Cambodia | 13.7 /100 | #203 | Poor 18.1% |
| Immigrants | Eastern Africa | 13.4 /100 | #204 | Poor 18.1% |
| Spaniards | 12.8 /100 | #205 | Poor 18.1% |
| Whites/Caucasians | 12.6 /100 | #206 | Poor 18.1% |
| Immigrants | Immigrants | 9.9 /100 | #207 | Tragic 18.2% |
| Scotch-Irish | 9.8 /100 | #208 | Tragic 18.2% |
| Spanish | 9.8 /100 | #209 | Tragic 18.2% |
| Panamanians | 9.7 /100 | #210 | Tragic 18.2% |
| Moroccans | 9.4 /100 | #211 | Tragic 18.2% |
| Nepalese | 8.7 /100 | #212 | Tragic 18.3% |
| Immigrants | Thailand | 8.6 /100 | #213 | Tragic 18.3% |
Demographics Similar to Immigrants from Bahamas by Child Poverty Under the Age of 5
In terms of child poverty under the age of 5, the demographic groups most similar to Immigrants from Bahamas are Immigrants from Dominica (22.7%, a difference of 0.040%), Houma (22.7%, a difference of 0.18%), African (22.8%, a difference of 0.59%), Seminole (22.8%, a difference of 0.63%), and Honduran (23.0%, a difference of 1.2%).
| Demographics | Rating | Rank | Child Poverty Under the Age of 5 |
| Alaskan Athabascans | 0.0 /100 | #300 | Tragic 21.8% |
| Immigrants | Central America | 0.0 /100 | #301 | Tragic 22.0% |
| Iroquois | 0.0 /100 | #302 | Tragic 22.0% |
| Inupiat | 0.0 /100 | #303 | Tragic 22.0% |
| Immigrants | Guatemala | 0.0 /100 | #304 | Tragic 22.0% |
| Immigrants | Mexico | 0.0 /100 | #305 | Tragic 22.2% |
| Indonesians | 0.0 /100 | #306 | Tragic 22.3% |
| Immigrants | Bahamas | 0.0 /100 | #307 | Tragic 22.7% |
| Immigrants | Dominica | 0.0 /100 | #308 | Tragic 22.7% |
| Houma | 0.0 /100 | #309 | Tragic 22.7% |
| Africans | 0.0 /100 | #310 | Tragic 22.8% |
| Seminole | 0.0 /100 | #311 | Tragic 22.8% |
| Hondurans | 0.0 /100 | #312 | Tragic 23.0% |
| Bahamians | 0.0 /100 | #313 | Tragic 23.0% |
| U.S. Virgin Islanders | 0.0 /100 | #314 | Tragic 23.0% |