West Indian vs Immigrants from Albania Unemployment Among Seniors over 65 years
COMPARE
West Indian
Immigrants from Albania
Unemployment Among Seniors over 65 years
Unemployment Among Seniors over 65 years Comparison
West Indians
Immigrants from Albania
5.4%
UNEMPLOYMENT AMONG SENIORS OVER 65 YEARS
0.6/ 100
METRIC RATING
251st/ 347
METRIC RANK
5.3%
UNEMPLOYMENT AMONG SENIORS OVER 65 YEARS
2.7/ 100
METRIC RATING
235th/ 347
METRIC RANK
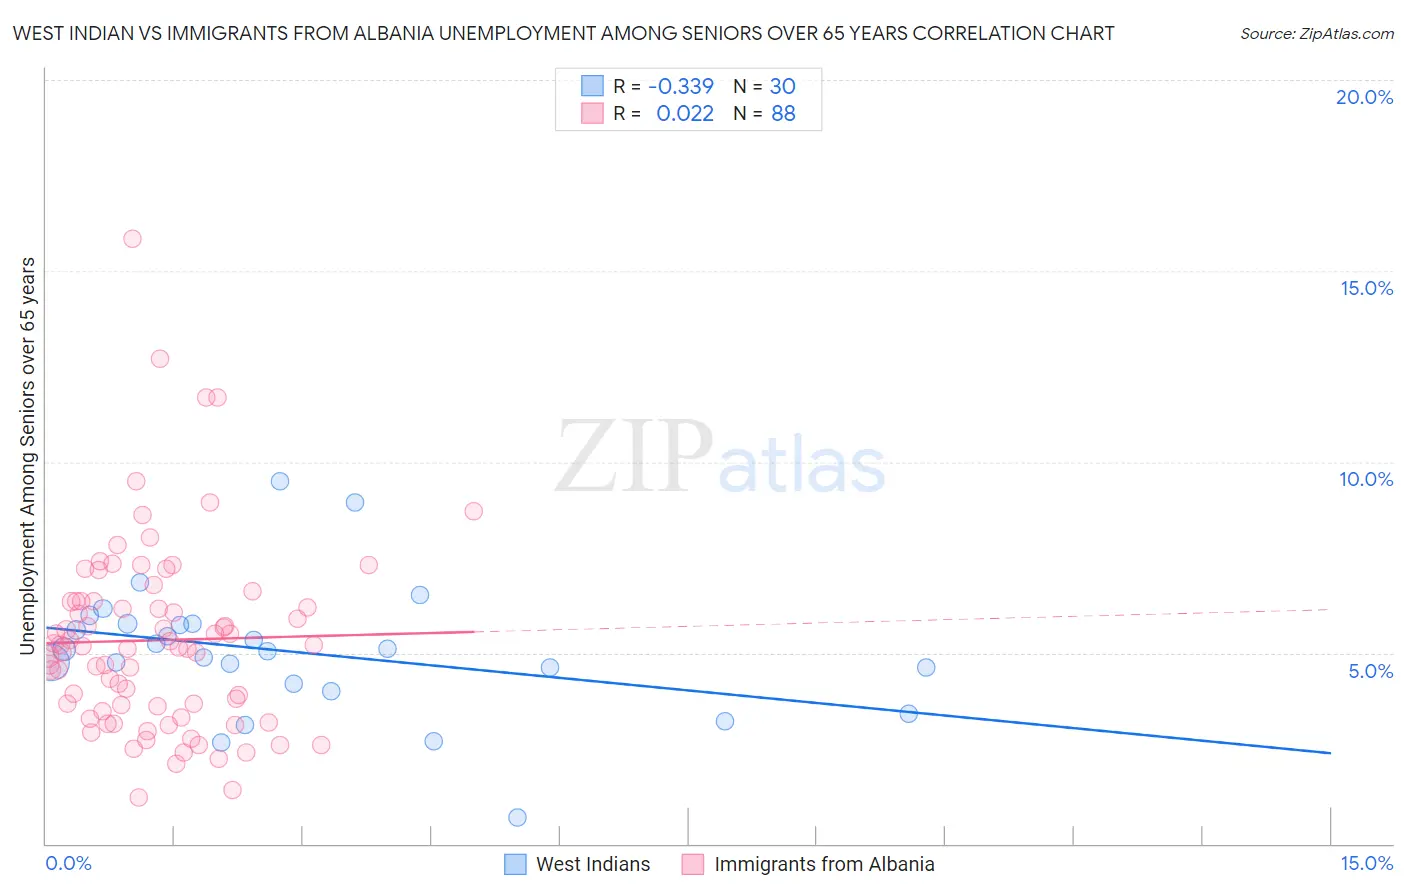
West Indian vs Immigrants from Albania Unemployment Among Seniors over 65 years Correlation Chart
The statistical analysis conducted on geographies consisting of 238,071,807 people shows a mild negative correlation between the proportion of West Indians and unemployment rate amomg seniors over the age of 65 in the United States with a correlation coefficient (R) of -0.339 and weighted average of 5.4%. Similarly, the statistical analysis conducted on geographies consisting of 115,063,941 people shows no correlation between the proportion of Immigrants from Albania and unemployment rate amomg seniors over the age of 65 in the United States with a correlation coefficient (R) of 0.022 and weighted average of 5.3%, a difference of 1.2%.
Unemployment Among Seniors over 65 years Correlation Summary
| Measurement | West Indian | Immigrants from Albania |
| Minimum | 0.70% | 1.2% |
| Maximum | 9.5% | 15.9% |
| Range | 8.8% | 14.7% |
| Mean | 5.0% | 5.3% |
| Median | 5.1% | 5.1% |
| Interquartile 25% (IQ1) | 4.2% | 3.5% |
| Interquartile 75% (IQ3) | 5.8% | 6.3% |
| Interquartile Range (IQR) | 1.6% | 2.8% |
| Standard Deviation (Sample) | 1.7% | 2.5% |
| Standard Deviation (Population) | 1.7% | 2.5% |
Demographics Similar to West Indians and Immigrants from Albania by Unemployment Among Seniors over 65 years
In terms of unemployment among seniors over 65 years, the demographic groups most similar to West Indians are Immigrants (5.4%, a difference of 0.010%), Ghanaian (5.4%, a difference of 0.010%), French Canadian (5.4%, a difference of 0.030%), Trinidadian and Tobagonian (5.4%, a difference of 0.070%), and Immigrants from Caribbean (5.3%, a difference of 0.090%). Similarly, the demographic groups most similar to Immigrants from Albania are Marshallese (5.3%, a difference of 0.10%), Blackfeet (5.3%, a difference of 0.10%), Immigrants from Costa Rica (5.3%, a difference of 0.19%), Immigrants from Greece (5.3%, a difference of 0.25%), and Immigrants from Israel (5.3%, a difference of 0.26%).
| Demographics | Rating | Rank | Unemployment Among Seniors over 65 years |
| Marshallese | 3.1 /100 | #233 | Tragic 5.3% |
| Blackfeet | 3.1 /100 | #234 | Tragic 5.3% |
| Immigrants | Albania | 2.7 /100 | #235 | Tragic 5.3% |
| Immigrants | Costa Rica | 2.1 /100 | #236 | Tragic 5.3% |
| Immigrants | Greece | 2.0 /100 | #237 | Tragic 5.3% |
| Immigrants | Israel | 2.0 /100 | #238 | Tragic 5.3% |
| Immigrants | Senegal | 1.8 /100 | #239 | Tragic 5.3% |
| Immigrants | Trinidad and Tobago | 1.6 /100 | #240 | Tragic 5.3% |
| Apache | 1.3 /100 | #241 | Tragic 5.3% |
| Bahamians | 0.9 /100 | #242 | Tragic 5.3% |
| Nigerians | 0.9 /100 | #243 | Tragic 5.3% |
| Peruvians | 0.8 /100 | #244 | Tragic 5.3% |
| Ottawa | 0.8 /100 | #245 | Tragic 5.3% |
| Colombians | 0.7 /100 | #246 | Tragic 5.3% |
| Immigrants | Caribbean | 0.7 /100 | #247 | Tragic 5.3% |
| French Canadians | 0.7 /100 | #248 | Tragic 5.4% |
| Immigrants | Immigrants | 0.6 /100 | #249 | Tragic 5.4% |
| Ghanaians | 0.6 /100 | #250 | Tragic 5.4% |
| West Indians | 0.6 /100 | #251 | Tragic 5.4% |
| Trinidadians and Tobagonians | 0.6 /100 | #252 | Tragic 5.4% |
| Immigrants | Sierra Leone | 0.6 /100 | #253 | Tragic 5.4% |