Cambodian vs Salvadoran Child Poverty Among Boys Under 16
COMPARE
Cambodian
Salvadoran
Child Poverty Among Boys Under 16
Child Poverty Among Boys Under 16 Comparison
Cambodians
Salvadorans
14.5%
CHILD POVERTY AMONG BOYS UNDER 16
98.5/ 100
METRIC RATING
63rd/ 347
METRIC RANK
19.0%
CHILD POVERTY AMONG BOYS UNDER 16
0.3/ 100
METRIC RATING
248th/ 347
METRIC RANK
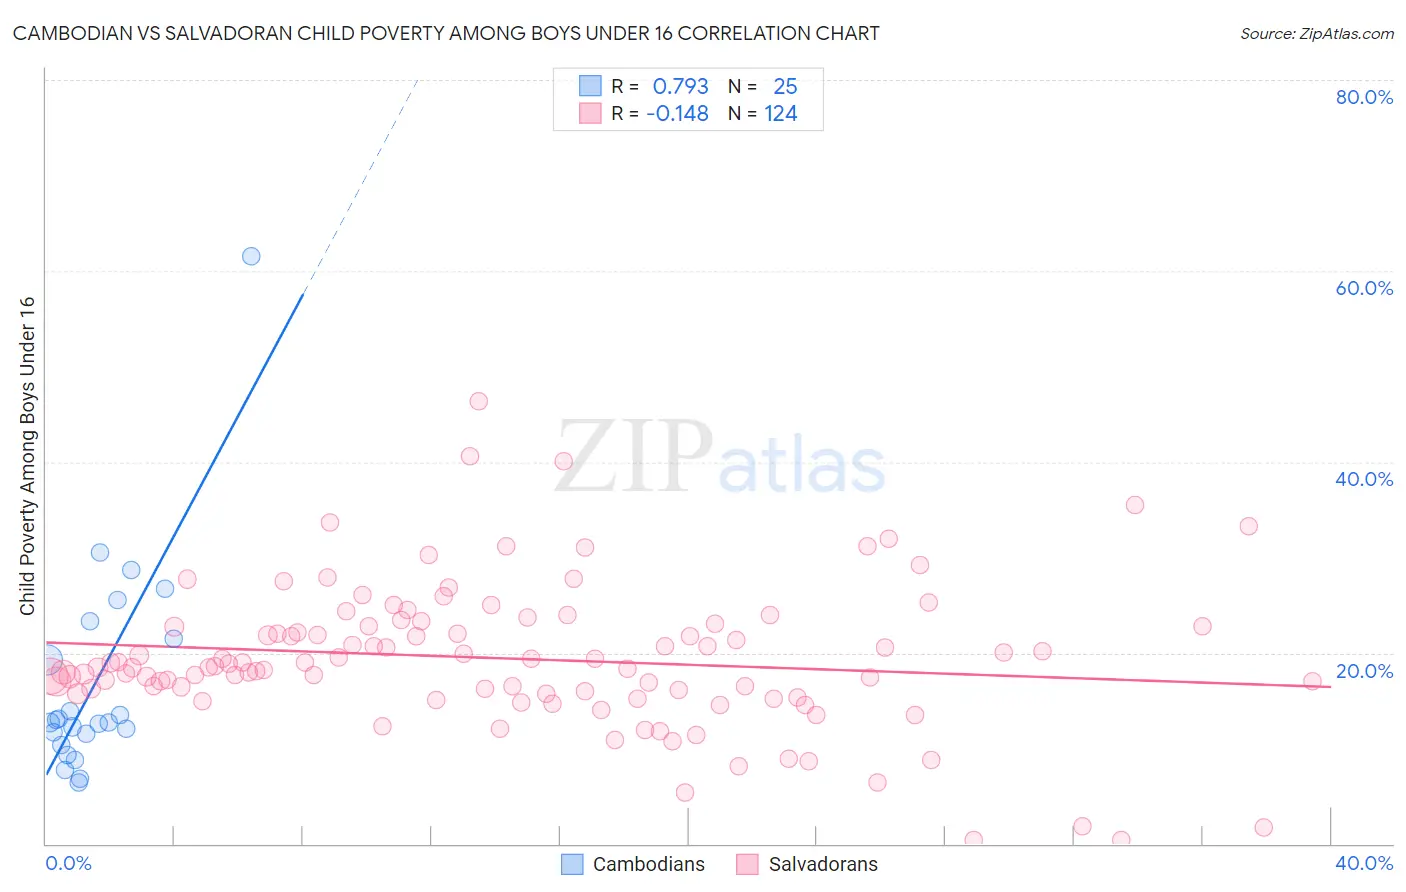
Cambodian vs Salvadoran Child Poverty Among Boys Under 16 Correlation Chart
The statistical analysis conducted on geographies consisting of 102,113,836 people shows a strong positive correlation between the proportion of Cambodians and poverty level among boys under the age of 16 in the United States with a correlation coefficient (R) of 0.793 and weighted average of 14.5%. Similarly, the statistical analysis conducted on geographies consisting of 394,231,551 people shows a poor negative correlation between the proportion of Salvadorans and poverty level among boys under the age of 16 in the United States with a correlation coefficient (R) of -0.148 and weighted average of 19.0%, a difference of 31.3%.
Child Poverty Among Boys Under 16 Correlation Summary
| Measurement | Cambodian | Salvadoran |
| Minimum | 6.4% | 0.35% |
| Maximum | 61.5% | 46.3% |
| Range | 55.1% | 46.0% |
| Mean | 17.0% | 19.4% |
| Median | 12.7% | 18.5% |
| Interquartile 25% (IQ1) | 10.9% | 15.9% |
| Interquartile 75% (IQ3) | 22.4% | 22.8% |
| Interquartile Range (IQR) | 11.4% | 6.9% |
| Standard Deviation (Sample) | 11.6% | 7.5% |
| Standard Deviation (Population) | 11.4% | 7.5% |
Similar Demographics by Child Poverty Among Boys Under 16
Demographics Similar to Cambodians by Child Poverty Among Boys Under 16
In terms of child poverty among boys under 16, the demographic groups most similar to Cambodians are Immigrants from Romania (14.5%, a difference of 0.13%), Soviet Union (14.5%, a difference of 0.16%), Immigrants from Bulgaria (14.5%, a difference of 0.17%), Immigrants from Europe (14.5%, a difference of 0.19%), and Slovene (14.5%, a difference of 0.28%).
| Demographics | Rating | Rank | Child Poverty Among Boys Under 16 |
| Zimbabweans | 99.0 /100 | #56 | Exceptional 14.3% |
| Poles | 98.9 /100 | #57 | Exceptional 14.4% |
| Immigrants | Sweden | 98.9 /100 | #58 | Exceptional 14.4% |
| Immigrants | Czechoslovakia | 98.9 /100 | #59 | Exceptional 14.4% |
| Immigrants | Belgium | 98.9 /100 | #60 | Exceptional 14.4% |
| Scandinavians | 98.8 /100 | #61 | Exceptional 14.4% |
| Immigrants | Israel | 98.7 /100 | #62 | Exceptional 14.4% |
| Cambodians | 98.5 /100 | #63 | Exceptional 14.5% |
| Immigrants | Romania | 98.5 /100 | #64 | Exceptional 14.5% |
| Soviet Union | 98.5 /100 | #65 | Exceptional 14.5% |
| Immigrants | Bulgaria | 98.5 /100 | #66 | Exceptional 14.5% |
| Immigrants | Europe | 98.4 /100 | #67 | Exceptional 14.5% |
| Slovenes | 98.4 /100 | #68 | Exceptional 14.5% |
| Immigrants | Austria | 98.4 /100 | #69 | Exceptional 14.5% |
| Europeans | 98.4 /100 | #70 | Exceptional 14.5% |
Demographics Similar to Salvadorans by Child Poverty Among Boys Under 16
In terms of child poverty among boys under 16, the demographic groups most similar to Salvadorans are Immigrants from Trinidad and Tobago (19.0%, a difference of 0.080%), Alsatian (19.1%, a difference of 0.17%), Immigrants from Nicaragua (19.0%, a difference of 0.20%), Cree (19.0%, a difference of 0.40%), and Immigrants from Middle Africa (18.9%, a difference of 0.53%).
| Demographics | Rating | Rank | Child Poverty Among Boys Under 16 |
| Immigrants | Sudan | 0.6 /100 | #241 | Tragic 18.8% |
| Ghanaians | 0.5 /100 | #242 | Tragic 18.9% |
| Immigrants | Azores | 0.4 /100 | #243 | Tragic 18.9% |
| Immigrants | Middle Africa | 0.4 /100 | #244 | Tragic 18.9% |
| Cree | 0.4 /100 | #245 | Tragic 19.0% |
| Immigrants | Nicaragua | 0.4 /100 | #246 | Tragic 19.0% |
| Immigrants | Trinidad and Tobago | 0.3 /100 | #247 | Tragic 19.0% |
| Salvadorans | 0.3 /100 | #248 | Tragic 19.0% |
| Alsatians | 0.3 /100 | #249 | Tragic 19.1% |
| Immigrants | Burma/Myanmar | 0.2 /100 | #250 | Tragic 19.2% |
| French American Indians | 0.2 /100 | #251 | Tragic 19.2% |
| Immigrants | Western Africa | 0.2 /100 | #252 | Tragic 19.3% |
| Liberians | 0.2 /100 | #253 | Tragic 19.3% |
| Trinidadians and Tobagonians | 0.2 /100 | #254 | Tragic 19.3% |
| Ecuadorians | 0.2 /100 | #255 | Tragic 19.3% |