Portuguese vs Immigrants from Congo Female Poverty Among 25-34 Year Olds
COMPARE
Portuguese
Immigrants from Congo
Female Poverty Among 25-34 Year Olds
Female Poverty Among 25-34 Year Olds Comparison
Portuguese
Immigrants from Congo
13.6%
FEMALE POVERTY AMONG 25-34 YEAR OLDS
40.3/ 100
METRIC RATING
183rd/ 347
METRIC RANK
16.7%
FEMALE POVERTY AMONG 25-34 YEAR OLDS
0.0/ 100
METRIC RATING
301st/ 347
METRIC RANK
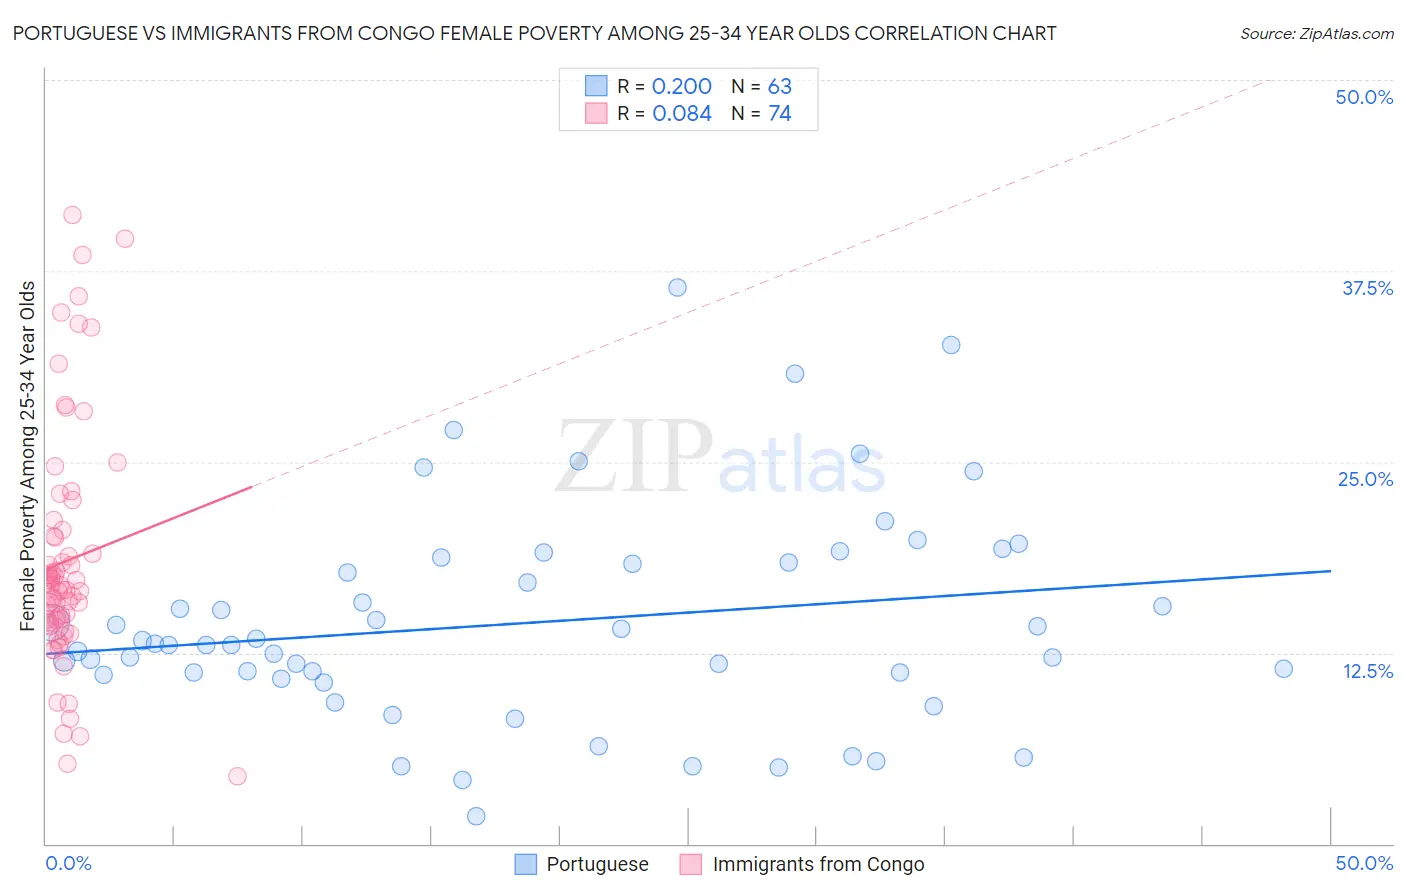
Portuguese vs Immigrants from Congo Female Poverty Among 25-34 Year Olds Correlation Chart
The statistical analysis conducted on geographies consisting of 439,781,405 people shows a weak positive correlation between the proportion of Portuguese and poverty level among females between the ages 25 and 34 in the United States with a correlation coefficient (R) of 0.200 and weighted average of 13.6%. Similarly, the statistical analysis conducted on geographies consisting of 91,915,902 people shows a slight positive correlation between the proportion of Immigrants from Congo and poverty level among females between the ages 25 and 34 in the United States with a correlation coefficient (R) of 0.084 and weighted average of 16.7%, a difference of 22.7%.
Female Poverty Among 25-34 Year Olds Correlation Summary
| Measurement | Portuguese | Immigrants from Congo |
| Minimum | 1.8% | 4.4% |
| Maximum | 36.4% | 41.2% |
| Range | 34.6% | 36.8% |
| Mean | 14.5% | 18.5% |
| Median | 13.0% | 16.8% |
| Interquartile 25% (IQ1) | 11.1% | 14.5% |
| Interquartile 75% (IQ3) | 18.5% | 20.1% |
| Interquartile Range (IQR) | 7.4% | 5.7% |
| Standard Deviation (Sample) | 7.0% | 7.8% |
| Standard Deviation (Population) | 6.9% | 7.7% |
Similar Demographics by Female Poverty Among 25-34 Year Olds
Demographics Similar to Portuguese by Female Poverty Among 25-34 Year Olds
In terms of female poverty among 25-34 year olds, the demographic groups most similar to Portuguese are Immigrants from Venezuela (13.6%, a difference of 0.030%), Guamanian/Chamorro (13.6%, a difference of 0.10%), German (13.6%, a difference of 0.11%), Immigrants from Eastern Africa (13.6%, a difference of 0.28%), and Czechoslovakian (13.7%, a difference of 0.31%).
| Demographics | Rating | Rank | Female Poverty Among 25-34 Year Olds |
| Yugoslavians | 45.0 /100 | #176 | Average 13.6% |
| Venezuelans | 44.6 /100 | #177 | Average 13.6% |
| Canadians | 44.3 /100 | #178 | Average 13.6% |
| Immigrants | Eastern Africa | 43.6 /100 | #179 | Average 13.6% |
| Germans | 41.6 /100 | #180 | Average 13.6% |
| Guamanians/Chamorros | 41.5 /100 | #181 | Average 13.6% |
| Immigrants | Venezuela | 40.7 /100 | #182 | Average 13.6% |
| Portuguese | 40.3 /100 | #183 | Average 13.6% |
| Czechoslovakians | 36.8 /100 | #184 | Fair 13.7% |
| Irish | 35.3 /100 | #185 | Fair 13.7% |
| Immigrants | Uruguay | 34.1 /100 | #186 | Fair 13.7% |
| Slovaks | 34.1 /100 | #187 | Fair 13.7% |
| Immigrants | Eritrea | 32.7 /100 | #188 | Fair 13.7% |
| Finns | 32.5 /100 | #189 | Fair 13.7% |
| Dutch | 29.7 /100 | #190 | Fair 13.8% |
Demographics Similar to Immigrants from Congo by Female Poverty Among 25-34 Year Olds
In terms of female poverty among 25-34 year olds, the demographic groups most similar to Immigrants from Congo are U.S. Virgin Islander (16.7%, a difference of 0.010%), Alaska Native (16.8%, a difference of 0.11%), Spanish American (16.7%, a difference of 0.16%), Blackfeet (16.7%, a difference of 0.20%), and Immigrants from Mexico (16.8%, a difference of 0.43%).
| Demographics | Rating | Rank | Female Poverty Among 25-34 Year Olds |
| Immigrants | Central America | 0.0 /100 | #294 | Tragic 16.6% |
| Mexicans | 0.0 /100 | #295 | Tragic 16.6% |
| Hispanics or Latinos | 0.0 /100 | #296 | Tragic 16.6% |
| Immigrants | Guatemala | 0.0 /100 | #297 | Tragic 16.6% |
| Blackfeet | 0.0 /100 | #298 | Tragic 16.7% |
| Spanish Americans | 0.0 /100 | #299 | Tragic 16.7% |
| U.S. Virgin Islanders | 0.0 /100 | #300 | Tragic 16.7% |
| Immigrants | Congo | 0.0 /100 | #301 | Tragic 16.7% |
| Alaska Natives | 0.0 /100 | #302 | Tragic 16.8% |
| Immigrants | Mexico | 0.0 /100 | #303 | Tragic 16.8% |
| Hondurans | 0.0 /100 | #304 | Tragic 16.9% |
| Immigrants | Cabo Verde | 0.0 /100 | #305 | Tragic 16.9% |
| Chickasaw | 0.0 /100 | #306 | Tragic 17.0% |
| Yaqui | 0.0 /100 | #307 | Tragic 17.0% |
| Africans | 0.0 /100 | #308 | Tragic 17.0% |