Vietnamese vs Immigrants from Syria Female Poverty Among 18-24 Year Olds

COMPARE

Vietnamese
Race
Ancestry
AfghanAfricanAlaska NativeAlaskan AthabascanAlbanianAleutAlsatianAmericanApacheArabArapahoArgentineanArmenianAssyrian/Chaldean/SyriacAustralianAustrianBahamianBangladeshiBarbadianBasqueBelgianBelizeanBermudanBhutaneseBlackfeetBolivianBrazilianBritishBritish West IndianBulgarianBurmeseCajunCambodianCanadianCape VerdeanCarpatho RusynCelticCentral AmericanCentral American IndianCherokeeCheyenneChickasawChileanChineseChippewaChoctawColombianColvilleComancheCosta RicanCreeCreekCroatianCrowCubanCypriotCzechCzechoslovakianDanishDelawareDominicanDutchDutch West IndianEastern EuropeanEcuadorianEgyptianEnglishEstonianEthiopianEuropeanFijianFilipinoFinnishFrenchFrench American IndianFrench CanadianGermanGerman RussianGhanaianGreekGuamanian/ChamorroGuatemalanGuyaneseHaitianHmongHonduranHopiHoumaHungarianIcelanderIndian (Asian)IndonesianInupiatIranianIraqiIrishIroquoisIsraeliItalianJamaicanJapaneseJordanianKenyanKiowaKoreanLaotianLatvianLebaneseLiberianLithuanianLumbeeLuxembourgerMacedonianMalaysianMalteseMarshalleseMenomineeMexicanMexican American IndianMongolianMoroccanNative HawaiianNavajoNepaleseNew ZealanderNicaraguanNigerianNorthern EuropeanNorwegianOkinawanOsageOttawaPaiutePakistaniPalestinianPanamanianParaguayanPennsylvania GermanPeruvianPimaPolishPortuguesePotawatomiPuebloPuerto RicanPuget Sound SalishRomanianRussianSalvadoranSamoanScandinavianScotch-IrishScottishSeminoleSenegaleseSerbianShoshoneSierra LeoneanSiouxSlavicSlovakSloveneSomaliSouth AfricanSouth AmericanSouth American IndianSoviet UnionSpaniardSpanishSpanish AmericanSpanish American IndianSri LankanSubsaharan AfricanSudaneseSwedishSwissSyrianTaiwaneseThaiTlingit-HaidaTohono O'OdhamTonganTrinidadian and TobagonianTsimshianTurkishU.S. Virgin IslanderUgandanUkrainianUruguayanUteVenezuelanVietnameseWelshWest IndianYakamaYaquiYugoslavianYumanYup'ikZimbabwean
Immigration
NonimmigrantsImmigrantsAfghanistanAfricaAlbaniaArgentinaArmeniaAsiaAustraliaAustriaBahamasBangladeshBarbadosBelarusBelgiumBelizeBoliviaBosnia and HerzegovinaBrazilBulgariaBurma/MyanmarCabo VerdeCambodiaCameroonCanadaCaribbeanCentral AmericaChileChinaColombiaCongoCosta RicaCroatiaCubaCzechoslovakiaDenmarkDominicaDominican RepublicEastern AfricaEastern AsiaEastern EuropeEcuadorEgyptEl SalvadorEnglandEritreaEthiopiaEuropeFijiFranceGermanyGhanaGreeceGrenadaGuatemalaGuyanaHaitiHondurasHong KongHungaryIndiaIndonesiaIranIraqIrelandIsraelItalyJamaicaJapanJordanKazakhstanKenyaKoreaKuwaitLaosLatin AmericaLatviaLebanonLiberiaLithuaniaMalaysiaMexicoMicronesiaMiddle AfricaMoldovaMoroccoNepalNetherlandsNicaraguaNigeriaNorth AmericaNorth MacedoniaNorthern AfricaNorthern EuropeNorwayOceaniaPakistanPanamaPeruPhilippinesPolandPortugalRomaniaRussiaSaudi ArabiaScotlandSenegalSerbiaSierra LeoneSingaporeSomaliaSouth AfricaSouth AmericaSouth Central AsiaSouth Eastern AsiaSouthern EuropeSpainSri LankaSt. Vincent and the GrenadinesSudanSwedenSwitzerlandTaiwanThailandTrinidad and TobagoTurkeyUgandaUkraineUruguayUzbekistanVenezuelaVietnamWest IndiesWestern AfricaWestern AsiaWestern EuropeYemenZaireZimbabweAzores
Immigrants from Syria
Race
Ancestry
AfghanAfricanAlaska NativeAlaskan AthabascanAlbanianAleutAlsatianAmericanApacheArabArapahoArgentineanArmenianAssyrian/Chaldean/SyriacAustralianAustrianBahamianBangladeshiBarbadianBasqueBelgianBelizeanBermudanBhutaneseBlackfeetBolivianBrazilianBritishBritish West IndianBulgarianBurmeseCajunCambodianCanadianCape VerdeanCarpatho RusynCelticCentral AmericanCentral American IndianCherokeeCheyenneChickasawChileanChineseChippewaChoctawColombianColvilleComancheCosta RicanCreeCreekCroatianCrowCubanCypriotCzechCzechoslovakianDanishDelawareDominicanDutchDutch West IndianEastern EuropeanEcuadorianEgyptianEnglishEstonianEthiopianEuropeanFijianFilipinoFinnishFrenchFrench American IndianFrench CanadianGermanGerman RussianGhanaianGreekGuamanian/ChamorroGuatemalanGuyaneseHaitianHmongHonduranHopiHoumaHungarianIcelanderIndian (Asian)IndonesianInupiatIranianIraqiIrishIroquoisIsraeliItalianJamaicanJapaneseJordanianKenyanKiowaKoreanLaotianLatvianLebaneseLiberianLithuanianLumbeeLuxembourgerMacedonianMalaysianMalteseMarshalleseMenomineeMexicanMexican American IndianMongolianMoroccanNative HawaiianNavajoNepaleseNew ZealanderNicaraguanNigerianNorthern EuropeanNorwegianOkinawanOsageOttawaPaiutePakistaniPalestinianPanamanianParaguayanPennsylvania GermanPeruvianPimaPolishPortuguesePotawatomiPuebloPuerto RicanPuget Sound SalishRomanianRussianSalvadoranSamoanScandinavianScotch-IrishScottishSeminoleSenegaleseSerbianShoshoneSierra LeoneanSiouxSlavicSlovakSloveneSomaliSouth AfricanSouth AmericanSouth American IndianSoviet UnionSpaniardSpanishSpanish AmericanSpanish American IndianSri LankanSubsaharan AfricanSudaneseSwedishSwissSyrianTaiwaneseThaiTlingit-HaidaTohono O'OdhamTonganTrinidadian and TobagonianTsimshianTurkishU.S. Virgin IslanderUgandanUkrainianUruguayanUteVenezuelanWelshWest IndianYakamaYaquiYugoslavianYumanYup'ikZimbabwean
Immigration
NonimmigrantsImmigrantsAfghanistanAfricaAlbaniaArgentinaArmeniaAsiaAustraliaAustriaBahamasBangladeshBarbadosBelarusBelgiumBelizeBoliviaBosnia and HerzegovinaBrazilBulgariaBurma/MyanmarCabo VerdeCambodiaCameroonCanadaCaribbeanCentral AmericaChileChinaColombiaCongoCosta RicaCroatiaCubaCzechoslovakiaDenmarkDominicaDominican RepublicEastern AfricaEastern AsiaEastern EuropeEcuadorEgyptEl SalvadorEnglandEritreaEthiopiaEuropeFijiFranceGermanyGhanaGreeceGrenadaGuatemalaGuyanaHaitiHondurasHong KongHungaryIndiaIndonesiaIranIraqIrelandIsraelItalyJamaicaJapanJordanKazakhstanKenyaKoreaKuwaitLaosLatin AmericaLatviaLebanonLiberiaLithuaniaMalaysiaMexicoMicronesiaMiddle AfricaMoldovaMoroccoNepalNetherlandsNicaraguaNigeriaNorth AmericaNorth MacedoniaNorthern AfricaNorthern EuropeNorwayOceaniaPakistanPanamaPeruPhilippinesPolandPortugalRomaniaRussiaSaudi ArabiaScotlandSenegalSerbiaSierra LeoneSingaporeSomaliaSouth AfricaSouth AmericaSouth Central AsiaSouth Eastern AsiaSouthern EuropeSpainSri LankaSt. Vincent and the GrenadinesSudanSwedenSwitzerlandSyriaTaiwanThailandTrinidad and TobagoTurkeyUgandaUkraineUruguayUzbekistanVenezuelaVietnamWest IndiesWestern AfricaWestern AsiaWestern EuropeYemenZaireZimbabweAzores
Female Poverty Among 18-24 Year Olds
Income
Poverty
Unemployment
Labor Participation
Family Structure
Vehicle Availability
Education Level
Disability

Female Poverty Among 18-24 Year Olds Comparison

Vietnamese

Immigrants from Syria

Tragic
Exceptional
21.4%
FEMALE POVERTY AMONG 18-24 YEAR OLDS
0.6/ 100
METRIC RATING
258th/ 347
METRIC RANK
19.2%
FEMALE POVERTY AMONG 18-24 YEAR OLDS
97.2/ 100
METRIC RATING
109th/ 347
METRIC RANK

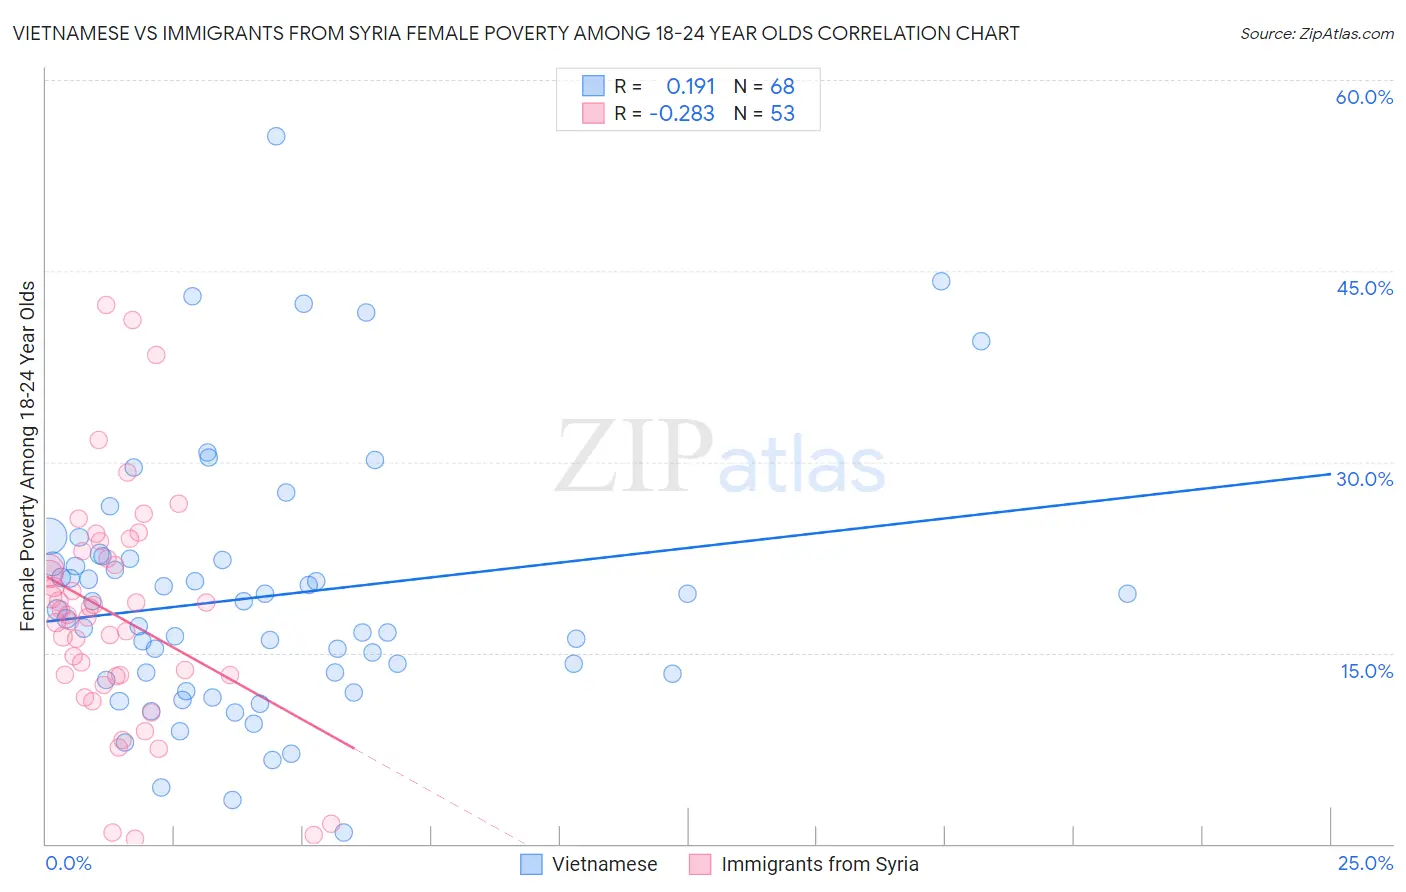
Vietnamese vs Immigrants from Syria Female Poverty Among 18-24 Year Olds Correlation Chart

The statistical analysis conducted on geographies consisting of 169,238,901 people shows a poor positive correlation between the proportion of Vietnamese and poverty level among females between the ages 18 and 24 in the United States with a correlation coefficient (R) of 0.191 and weighted average of 21.4%. Similarly, the statistical analysis conducted on geographies consisting of 172,353,428 people shows a weak negative correlation between the proportion of Immigrants from Syria and poverty level among females between the ages 18 and 24 in the United States with a correlation coefficient (R) of -0.283 and weighted average of 19.2%, a difference of 11.1%.
Vietnamese vs Immigrants from Syria Female Poverty Among 18-24 Year Olds

Female Poverty Among 18-24 Year Olds Correlation Summary

MeasurementVietnameseImmigrants from Syria
Minimum0.84%0.42%
Maximum55.6%42.3%
Range54.8%41.9%
Mean19.4%18.0%
Median18.0%18.0%
Interquartile 25% (IQ1)13.1%13.2%
Interquartile 75% (IQ3)22.3%22.7%
Interquartile Range (IQR)9.3%9.5%
Standard Deviation (Sample)10.2%9.0%
Standard Deviation (Population)10.1%8.9%

Similar Demographics by Female Poverty Among 18-24 Year Olds

Demographics Similar to Vietnamese by Female Poverty Among 18-24 Year Olds

In terms of female poverty among 18-24 year olds, the demographic groups most similar to Vietnamese are Immigrants from France (21.4%, a difference of 0.030%), Immigrants from Norway (21.4%, a difference of 0.080%), Immigrants from Bahamas (21.4%, a difference of 0.14%), Immigrants from Eastern Africa (21.4%, a difference of 0.34%), and Taiwanese (21.2%, a difference of 0.54%).
DemographicsRating | RankFemale Poverty Among 18-24 Year Olds
West Indians
1.9
/100
|
#251
Tragic
21.1%
South Africans
1.6
/100
|
#252
Tragic
21.1%
Delaware
1.6
/100
|
#253
Tragic
21.1%
British West Indians
1.2
/100
|
#254
Tragic
21.2%
Immigrants | Grenada
1.2
/100
|
#255
Tragic
21.2%
Tsimshian
1.0
/100
|
#256
Tragic
21.2%
Taiwanese
1.0
/100
|
#257
Tragic
21.2%
Vietnamese
0.6
/100
|
#258
Tragic
21.4%
Immigrants | France
0.6
/100
|
#259
Tragic
21.4%
Immigrants | Norway
0.6
/100
|
#260
Tragic
21.4%
Immigrants | Bahamas
0.5
/100
|
#261
Tragic
21.4%
Immigrants | Eastern Africa
0.4
/100
|
#262
Tragic
21.4%
Icelanders
0.3
/100
|
#263
Tragic
21.5%
Hondurans
0.3
/100
|
#264
Tragic
21.5%
Immigrants | Nonimmigrants
0.3
/100
|
#265
Tragic
21.5%

Demographics Similar to Immigrants from Syria by Female Poverty Among 18-24 Year Olds

In terms of female poverty among 18-24 year olds, the demographic groups most similar to Immigrants from Syria are Laotian (19.2%, a difference of 0.030%), Immigrants from Serbia (19.2%, a difference of 0.040%), Immigrants from Uzbekistan (19.2%, a difference of 0.080%), Immigrants from Sri Lanka (19.2%, a difference of 0.17%), and Immigrants from El Salvador (19.3%, a difference of 0.27%).
DemographicsRating | RankFemale Poverty Among 18-24 Year Olds
Immigrants | Caribbean
98.1
/100
|
#102
Exceptional
19.1%
Serbians
98.0
/100
|
#103
Exceptional
19.1%
Immigrants | Afghanistan
98.0
/100
|
#104
Exceptional
19.1%
Immigrants | Ecuador
97.8
/100
|
#105
Exceptional
19.2%
Immigrants | Sierra Leone
97.8
/100
|
#106
Exceptional
19.2%
Immigrants | Sri Lanka
97.5
/100
|
#107
Exceptional
19.2%
Immigrants | Uzbekistan
97.3
/100
|
#108
Exceptional
19.2%
Immigrants | Syria
97.2
/100
|
#109
Exceptional
19.2%
Laotians
97.1
/100
|
#110
Exceptional
19.2%
Immigrants | Serbia
97.1
/100
|
#111
Exceptional
19.2%
Immigrants | El Salvador
96.5
/100
|
#112
Exceptional
19.3%
Immigrants | Cameroon
96.3
/100
|
#113
Exceptional
19.3%
Slovenes
96.2
/100
|
#114
Exceptional
19.3%
Immigrants | Hungary
96.2
/100
|
#115
Exceptional
19.3%
Immigrants | Immigrants
95.9
/100
|
#116
Exceptional
19.3%