Venezuelan vs Immigrants from Eastern Africa Seniors Poverty Over the Age of 65

COMPARE

Venezuelan
Race
Ancestry
AfghanAfricanAlaska NativeAlaskan AthabascanAlbanianAleutAlsatianAmericanApacheArabArapahoArgentineanArmenianAssyrian/Chaldean/SyriacAustralianAustrianBahamianBangladeshiBarbadianBasqueBelgianBelizeanBermudanBhutaneseBlackfeetBolivianBrazilianBritishBritish West IndianBulgarianBurmeseCajunCambodianCanadianCape VerdeanCarpatho RusynCelticCentral AmericanCentral American IndianCherokeeCheyenneChickasawChileanChineseChippewaChoctawColombianColvilleComancheCosta RicanCreeCreekCroatianCrowCubanCypriotCzechCzechoslovakianDanishDelawareDominicanDutchDutch West IndianEastern EuropeanEcuadorianEgyptianEnglishEstonianEthiopianEuropeanFijianFilipinoFinnishFrenchFrench American IndianFrench CanadianGermanGerman RussianGhanaianGreekGuamanian/ChamorroGuatemalanGuyaneseHaitianHmongHonduranHopiHoumaHungarianIcelanderIndian (Asian)IndonesianInupiatIranianIraqiIrishIroquoisIsraeliItalianJamaicanJapaneseJordanianKenyanKiowaKoreanLaotianLatvianLebaneseLiberianLithuanianLumbeeLuxembourgerMacedonianMalaysianMalteseMarshalleseMenomineeMexicanMexican American IndianMongolianMoroccanNative HawaiianNavajoNepaleseNew ZealanderNicaraguanNigerianNorthern EuropeanNorwegianOkinawanOsageOttawaPaiutePakistaniPalestinianPanamanianParaguayanPennsylvania GermanPeruvianPimaPolishPortuguesePotawatomiPuebloPuerto RicanPuget Sound SalishRomanianRussianSalvadoranSamoanScandinavianScotch-IrishScottishSeminoleSenegaleseSerbianShoshoneSierra LeoneanSiouxSlavicSlovakSloveneSomaliSouth AfricanSouth AmericanSouth American IndianSoviet UnionSpaniardSpanishSpanish AmericanSpanish American IndianSri LankanSubsaharan AfricanSudaneseSwedishSwissSyrianTaiwaneseThaiTlingit-HaidaTohono O'OdhamTonganTrinidadian and TobagonianTsimshianTurkishU.S. Virgin IslanderUgandanUkrainianUruguayanUteVenezuelanVietnameseWelshWest IndianYakamaYaquiYugoslavianYumanYup'ikZimbabwean
Immigration
NonimmigrantsImmigrantsAfghanistanAfricaAlbaniaArgentinaArmeniaAsiaAustraliaAustriaBahamasBangladeshBarbadosBelarusBelgiumBelizeBoliviaBosnia and HerzegovinaBrazilBulgariaBurma/MyanmarCabo VerdeCambodiaCameroonCanadaCaribbeanCentral AmericaChileChinaColombiaCongoCosta RicaCroatiaCubaCzechoslovakiaDenmarkDominicaDominican RepublicEastern AsiaEastern EuropeEcuadorEgyptEl SalvadorEnglandEritreaEthiopiaEuropeFijiFranceGermanyGhanaGreeceGrenadaGuatemalaGuyanaHaitiHondurasHong KongHungaryIndiaIndonesiaIranIraqIrelandIsraelItalyJamaicaJapanJordanKazakhstanKenyaKoreaKuwaitLaosLatin AmericaLatviaLebanonLiberiaLithuaniaMalaysiaMexicoMicronesiaMiddle AfricaMoldovaMoroccoNepalNetherlandsNicaraguaNigeriaNorth AmericaNorth MacedoniaNorthern AfricaNorthern EuropeNorwayOceaniaPakistanPanamaPeruPhilippinesPolandPortugalRomaniaRussiaSaudi ArabiaScotlandSenegalSerbiaSierra LeoneSingaporeSomaliaSouth AfricaSouth AmericaSouth Central AsiaSouth Eastern AsiaSouthern EuropeSpainSri LankaSt. Vincent and the GrenadinesSudanSwedenSwitzerlandSyriaTaiwanThailandTrinidad and TobagoTurkeyUgandaUkraineUruguayUzbekistanVenezuelaVietnamWest IndiesWestern AfricaWestern AsiaWestern EuropeYemenZaireZimbabweAzores
Immigrants from Eastern Africa
Race
Ancestry
AfghanAfricanAlaska NativeAlaskan AthabascanAlbanianAleutAlsatianAmericanApacheArabArapahoArgentineanArmenianAssyrian/Chaldean/SyriacAustralianAustrianBahamianBangladeshiBarbadianBasqueBelgianBelizeanBermudanBhutaneseBlackfeetBolivianBrazilianBritishBritish West IndianBulgarianBurmeseCajunCambodianCanadianCape VerdeanCarpatho RusynCelticCentral AmericanCentral American IndianCherokeeCheyenneChickasawChileanChineseChippewaChoctawColombianColvilleComancheCosta RicanCreeCreekCroatianCrowCubanCypriotCzechCzechoslovakianDanishDelawareDominicanDutchDutch West IndianEastern EuropeanEcuadorianEgyptianEnglishEstonianEthiopianEuropeanFijianFilipinoFinnishFrenchFrench American IndianFrench CanadianGermanGerman RussianGhanaianGreekGuamanian/ChamorroGuatemalanGuyaneseHaitianHmongHonduranHopiHoumaHungarianIcelanderIndian (Asian)IndonesianInupiatIranianIraqiIrishIroquoisIsraeliItalianJamaicanJapaneseJordanianKenyanKiowaKoreanLaotianLatvianLebaneseLiberianLithuanianLumbeeLuxembourgerMacedonianMalaysianMalteseMarshalleseMenomineeMexicanMexican American IndianMongolianMoroccanNative HawaiianNavajoNepaleseNew ZealanderNicaraguanNigerianNorthern EuropeanNorwegianOkinawanOsageOttawaPaiutePakistaniPalestinianPanamanianParaguayanPennsylvania GermanPeruvianPimaPolishPortuguesePotawatomiPuebloPuerto RicanPuget Sound SalishRomanianRussianSalvadoranSamoanScandinavianScotch-IrishScottishSeminoleSenegaleseSerbianShoshoneSierra LeoneanSiouxSlavicSlovakSloveneSomaliSouth AfricanSouth AmericanSouth American IndianSoviet UnionSpaniardSpanishSpanish AmericanSpanish American IndianSri LankanSubsaharan AfricanSudaneseSwedishSwissSyrianTaiwaneseThaiTlingit-HaidaTohono O'OdhamTonganTrinidadian and TobagonianTsimshianTurkishU.S. Virgin IslanderUgandanUkrainianUruguayanUteVietnameseWelshWest IndianYakamaYaquiYugoslavianYumanYup'ikZimbabwean
Immigration
NonimmigrantsImmigrantsAfghanistanAfricaAlbaniaArgentinaArmeniaAsiaAustraliaAustriaBahamasBangladeshBarbadosBelarusBelgiumBelizeBoliviaBosnia and HerzegovinaBrazilBulgariaBurma/MyanmarCabo VerdeCambodiaCameroonCanadaCaribbeanCentral AmericaChileChinaColombiaCongoCosta RicaCroatiaCubaCzechoslovakiaDenmarkDominicaDominican RepublicEastern AfricaEastern AsiaEastern EuropeEcuadorEgyptEl SalvadorEnglandEritreaEthiopiaEuropeFijiFranceGermanyGhanaGreeceGrenadaGuatemalaGuyanaHaitiHondurasHong KongHungaryIndiaIndonesiaIranIraqIrelandIsraelItalyJamaicaJapanJordanKazakhstanKenyaKoreaKuwaitLaosLatin AmericaLatviaLebanonLiberiaLithuaniaMalaysiaMexicoMicronesiaMiddle AfricaMoldovaMoroccoNepalNetherlandsNicaraguaNigeriaNorth AmericaNorth MacedoniaNorthern AfricaNorthern EuropeNorwayOceaniaPakistanPanamaPeruPhilippinesPolandPortugalRomaniaRussiaSaudi ArabiaScotlandSenegalSerbiaSierra LeoneSingaporeSomaliaSouth AfricaSouth AmericaSouth Central AsiaSouth Eastern AsiaSouthern EuropeSpainSri LankaSt. Vincent and the GrenadinesSudanSwedenSwitzerlandSyriaTaiwanThailandTrinidad and TobagoTurkeyUgandaUkraineUruguayUzbekistanVenezuelaVietnamWest IndiesWestern AfricaWestern AsiaWestern EuropeYemenZaireZimbabweAzores
Seniors Poverty Over the Age of 65
Income
Poverty
Unemployment
Labor Participation
Family Structure
Vehicle Availability
Education Level
Disability

Seniors Poverty Over the Age of 65 Comparison

Venezuelans

Immigrants from Eastern Africa

Tragic
Average
12.5%
SENIORS POVERTY OVER THE AGE OF 65
0.1/ 100
METRIC RATING
262nd/ 347
METRIC RANK
11.0%
SENIORS POVERTY OVER THE AGE OF 65
43.4/ 100
METRIC RATING
181st/ 347
METRIC RANK

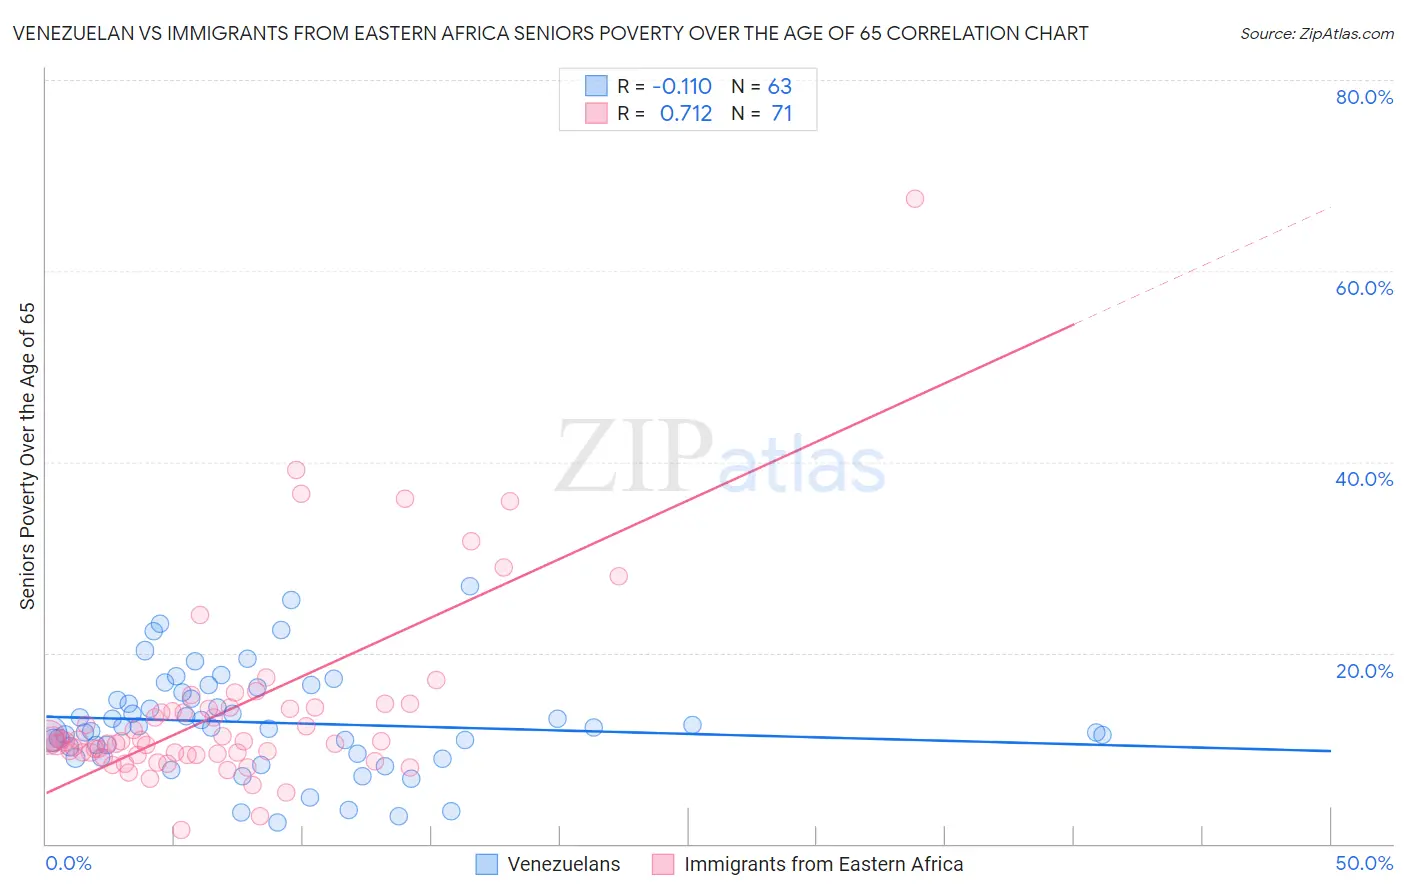
Venezuelan vs Immigrants from Eastern Africa Seniors Poverty Over the Age of 65 Correlation Chart

The statistical analysis conducted on geographies consisting of 305,272,622 people shows a poor negative correlation between the proportion of Venezuelans and poverty level among seniors over the age of 65 in the United States with a correlation coefficient (R) of -0.110 and weighted average of 12.5%. Similarly, the statistical analysis conducted on geographies consisting of 354,026,621 people shows a strong positive correlation between the proportion of Immigrants from Eastern Africa and poverty level among seniors over the age of 65 in the United States with a correlation coefficient (R) of 0.712 and weighted average of 11.0%, a difference of 13.9%.
Venezuelan vs Immigrants from Eastern Africa Seniors Poverty Over the Age of 65

Seniors Poverty Over the Age of 65 Correlation Summary

MeasurementVenezuelanImmigrants from Eastern Africa
Minimum2.2%1.4%
Maximum27.0%67.5%
Range24.8%66.1%
Mean12.7%14.0%
Median12.2%10.7%
Interquartile 25% (IQ1)9.4%9.3%
Interquartile 75% (IQ3)15.9%14.2%
Interquartile Range (IQR)6.5%4.9%
Standard Deviation (Sample)5.3%10.0%
Standard Deviation (Population)5.3%10.0%

Similar Demographics by Seniors Poverty Over the Age of 65

Demographics Similar to Venezuelans by Seniors Poverty Over the Age of 65

In terms of seniors poverty over the age of 65, the demographic groups most similar to Venezuelans are Soviet Union (12.6%, a difference of 0.17%), Colombian (12.5%, a difference of 0.20%), Inupiat (12.6%, a difference of 0.23%), Immigrants from Western Africa (12.6%, a difference of 0.32%), and South American (12.5%, a difference of 0.44%).
DemographicsRating | RankSeniors Poverty Over the Age of 65
Mexican American Indians
0.3
/100
|
#255
Tragic
12.4%
Immigrants | Panama
0.2
/100
|
#256
Tragic
12.4%
Immigrants | Immigrants
0.2
/100
|
#257
Tragic
12.4%
Dutch West Indians
0.2
/100
|
#258
Tragic
12.4%
Ghanaians
0.2
/100
|
#259
Tragic
12.4%
South Americans
0.2
/100
|
#260
Tragic
12.5%
Colombians
0.2
/100
|
#261
Tragic
12.5%
Venezuelans
0.1
/100
|
#262
Tragic
12.5%
Soviet Union
0.1
/100
|
#263
Tragic
12.6%
Inupiat
0.1
/100
|
#264
Tragic
12.6%
Immigrants | Western Africa
0.1
/100
|
#265
Tragic
12.6%
Africans
0.1
/100
|
#266
Tragic
12.6%
Blackfeet
0.1
/100
|
#267
Tragic
12.6%
Immigrants | Somalia
0.1
/100
|
#268
Tragic
12.6%
Immigrants | Venezuela
0.1
/100
|
#269
Tragic
12.7%

Demographics Similar to Immigrants from Eastern Africa by Seniors Poverty Over the Age of 65

In terms of seniors poverty over the age of 65, the demographic groups most similar to Immigrants from Eastern Africa are Immigrants from Thailand (11.0%, a difference of 0.0%), Immigrants from Northern Africa (11.0%, a difference of 0.10%), Immigrants from Fiji (11.0%, a difference of 0.13%), Immigrants from Kazakhstan (11.0%, a difference of 0.22%), and Immigrants from France (11.0%, a difference of 0.23%).
DemographicsRating | RankSeniors Poverty Over the Age of 65
Immigrants | Sudan
50.0
/100
|
#174
Average
10.9%
Creek
49.6
/100
|
#175
Average
10.9%
Immigrants | Malaysia
47.9
/100
|
#176
Average
11.0%
Cherokee
47.3
/100
|
#177
Average
11.0%
German Russians
46.9
/100
|
#178
Average
11.0%
Immigrants | Northern Africa
44.6
/100
|
#179
Average
11.0%
Immigrants | Thailand
43.5
/100
|
#180
Average
11.0%
Immigrants | Eastern Africa
43.4
/100
|
#181
Average
11.0%
Immigrants | Fiji
42.0
/100
|
#182
Average
11.0%
Immigrants | Kazakhstan
41.0
/100
|
#183
Average
11.0%
Immigrants | France
40.9
/100
|
#184
Average
11.0%
Immigrants | Lebanon
38.2
/100
|
#185
Fair
11.1%
Immigrants | Eastern Asia
37.5
/100
|
#186
Fair
11.1%
Immigrants | Middle Africa
37.4
/100
|
#187
Fair
11.1%
Immigrants | Hong Kong
36.3
/100
|
#188
Fair
11.1%