Ute vs Immigrants from Korea Seniors Poverty Over the Age of 75
COMPARE
Ute
Immigrants from Korea
Seniors Poverty Over the Age of 75
Seniors Poverty Over the Age of 75 Comparison
Ute
Immigrants from Korea
12.9%
SENIORS POVERTY OVER THE AGE OF 75
4.7/ 100
METRIC RATING
219th/ 347
METRIC RANK
12.0%
SENIORS POVERTY OVER THE AGE OF 75
65.5/ 100
METRIC RATING
152nd/ 347
METRIC RANK
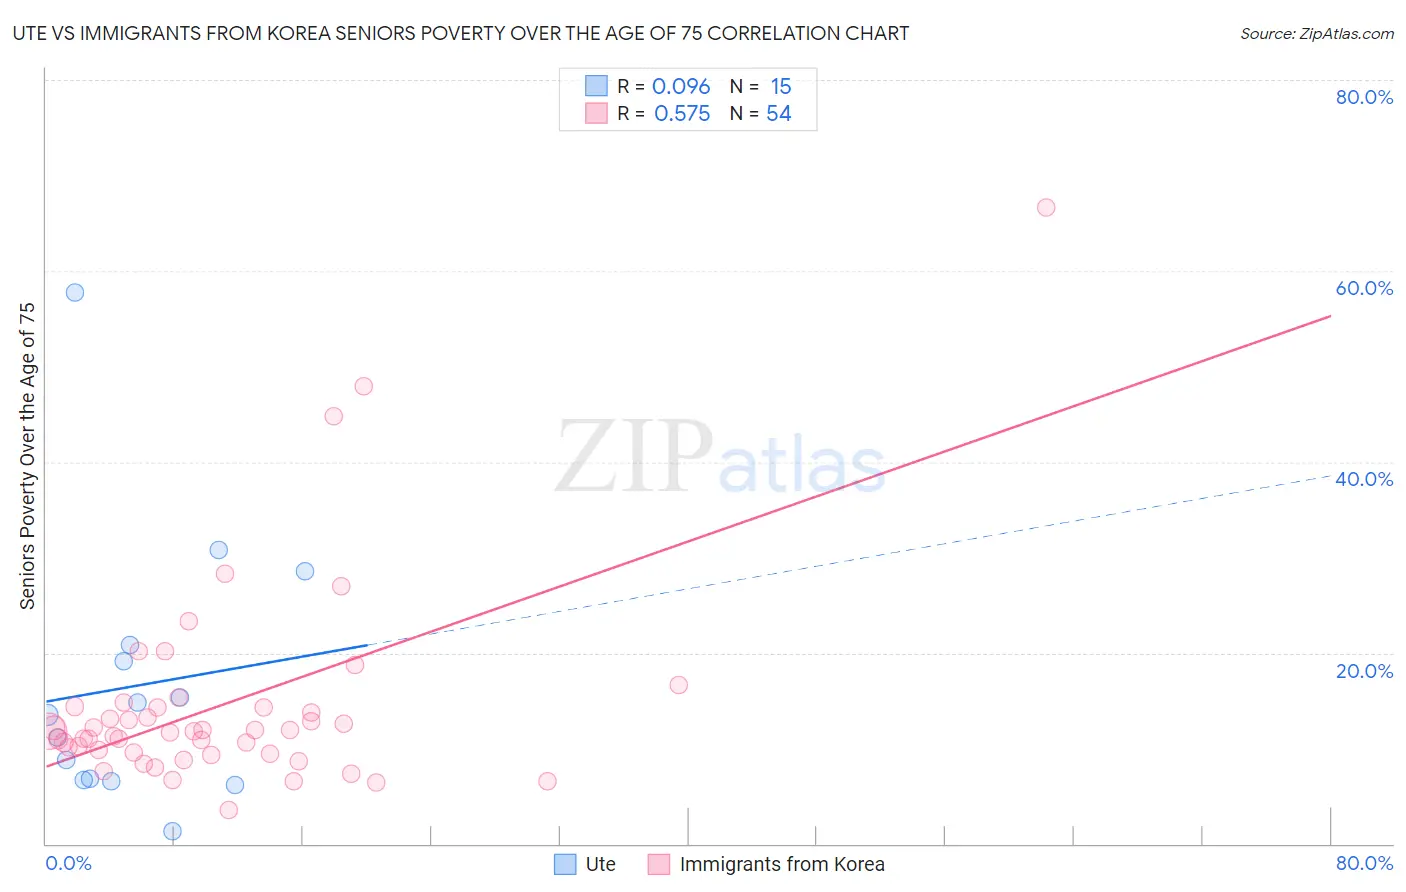
Ute vs Immigrants from Korea Seniors Poverty Over the Age of 75 Correlation Chart
The statistical analysis conducted on geographies consisting of 55,367,939 people shows a slight positive correlation between the proportion of Ute and poverty level among seniors over the age of 75 in the United States with a correlation coefficient (R) of 0.096 and weighted average of 12.9%. Similarly, the statistical analysis conducted on geographies consisting of 410,560,504 people shows a substantial positive correlation between the proportion of Immigrants from Korea and poverty level among seniors over the age of 75 in the United States with a correlation coefficient (R) of 0.575 and weighted average of 12.0%, a difference of 7.5%.
Seniors Poverty Over the Age of 75 Correlation Summary
| Measurement | Ute | Immigrants from Korea |
| Minimum | 1.4% | 3.6% |
| Maximum | 57.8% | 66.7% |
| Range | 56.4% | 63.1% |
| Mean | 16.5% | 14.5% |
| Median | 13.5% | 11.8% |
| Interquartile 25% (IQ1) | 6.7% | 9.6% |
| Interquartile 75% (IQ3) | 20.8% | 14.3% |
| Interquartile Range (IQR) | 14.1% | 4.7% |
| Standard Deviation (Sample) | 14.2% | 10.8% |
| Standard Deviation (Population) | 13.7% | 10.7% |
Similar Demographics by Seniors Poverty Over the Age of 75
Demographics Similar to Ute by Seniors Poverty Over the Age of 75
In terms of seniors poverty over the age of 75, the demographic groups most similar to Ute are Immigrants from Western Asia (12.9%, a difference of 0.060%), Bermudan (12.9%, a difference of 0.090%), Seminole (12.9%, a difference of 0.11%), Immigrants from Brazil (12.9%, a difference of 0.18%), and Immigrants from Kazakhstan (13.0%, a difference of 0.20%).
| Demographics | Rating | Rank | Seniors Poverty Over the Age of 75 |
| Immigrants | Hong Kong | 6.5 /100 | #212 | Tragic 12.8% |
| French American Indians | 6.1 /100 | #213 | Tragic 12.9% |
| Immigrants | Africa | 5.9 /100 | #214 | Tragic 12.9% |
| South American Indians | 5.5 /100 | #215 | Tragic 12.9% |
| Immigrants | Brazil | 5.2 /100 | #216 | Tragic 12.9% |
| Bermudans | 4.9 /100 | #217 | Tragic 12.9% |
| Immigrants | Western Asia | 4.9 /100 | #218 | Tragic 12.9% |
| Ute | 4.7 /100 | #219 | Tragic 12.9% |
| Seminole | 4.5 /100 | #220 | Tragic 12.9% |
| Immigrants | Kazakhstan | 4.3 /100 | #221 | Tragic 13.0% |
| Nigerians | 3.4 /100 | #222 | Tragic 13.0% |
| Immigrants | Nigeria | 3.3 /100 | #223 | Tragic 13.0% |
| Chippewa | 2.9 /100 | #224 | Tragic 13.1% |
| Immigrants | Morocco | 2.8 /100 | #225 | Tragic 13.1% |
| Shoshone | 2.6 /100 | #226 | Tragic 13.1% |
Demographics Similar to Immigrants from Korea by Seniors Poverty Over the Age of 75
In terms of seniors poverty over the age of 75, the demographic groups most similar to Immigrants from Korea are Cherokee (12.0%, a difference of 0.030%), Immigrants from Turkey (12.0%, a difference of 0.080%), Cambodian (12.0%, a difference of 0.14%), Cypriot (12.0%, a difference of 0.17%), and Asian (12.0%, a difference of 0.18%).
| Demographics | Rating | Rank | Seniors Poverty Over the Age of 75 |
| Immigrants | Belgium | 70.8 /100 | #145 | Good 12.0% |
| Bangladeshis | 70.4 /100 | #146 | Good 12.0% |
| Immigrants | Latvia | 69.1 /100 | #147 | Good 12.0% |
| Immigrants | Zaire | 67.6 /100 | #148 | Good 12.0% |
| Asians | 67.4 /100 | #149 | Good 12.0% |
| Cypriots | 67.3 /100 | #150 | Good 12.0% |
| Cherokee | 65.8 /100 | #151 | Good 12.0% |
| Immigrants | Korea | 65.5 /100 | #152 | Good 12.0% |
| Immigrants | Turkey | 64.7 /100 | #153 | Good 12.0% |
| Cambodians | 64.0 /100 | #154 | Good 12.0% |
| Indonesians | 62.6 /100 | #155 | Good 12.1% |
| Immigrants | Burma/Myanmar | 62.3 /100 | #156 | Good 12.1% |
| Immigrants | Sudan | 61.7 /100 | #157 | Good 12.1% |
| Portuguese | 61.3 /100 | #158 | Good 12.1% |
| Immigrants | Middle Africa | 61.2 /100 | #159 | Good 12.1% |