U.S. Virgin Islander vs Immigrants from Sierra Leone Seniors Poverty Over the Age of 75
COMPARE
U.S. Virgin Islander
Immigrants from Sierra Leone
Seniors Poverty Over the Age of 75
Seniors Poverty Over the Age of 75 Comparison
U.S. Virgin Islanders
Immigrants from Sierra Leone
15.4%
SENIORS POVERTY OVER THE AGE OF 75
0.0/ 100
METRIC RATING
295th/ 347
METRIC RANK
11.9%
SENIORS POVERTY OVER THE AGE OF 75
77.6/ 100
METRIC RATING
133rd/ 347
METRIC RANK
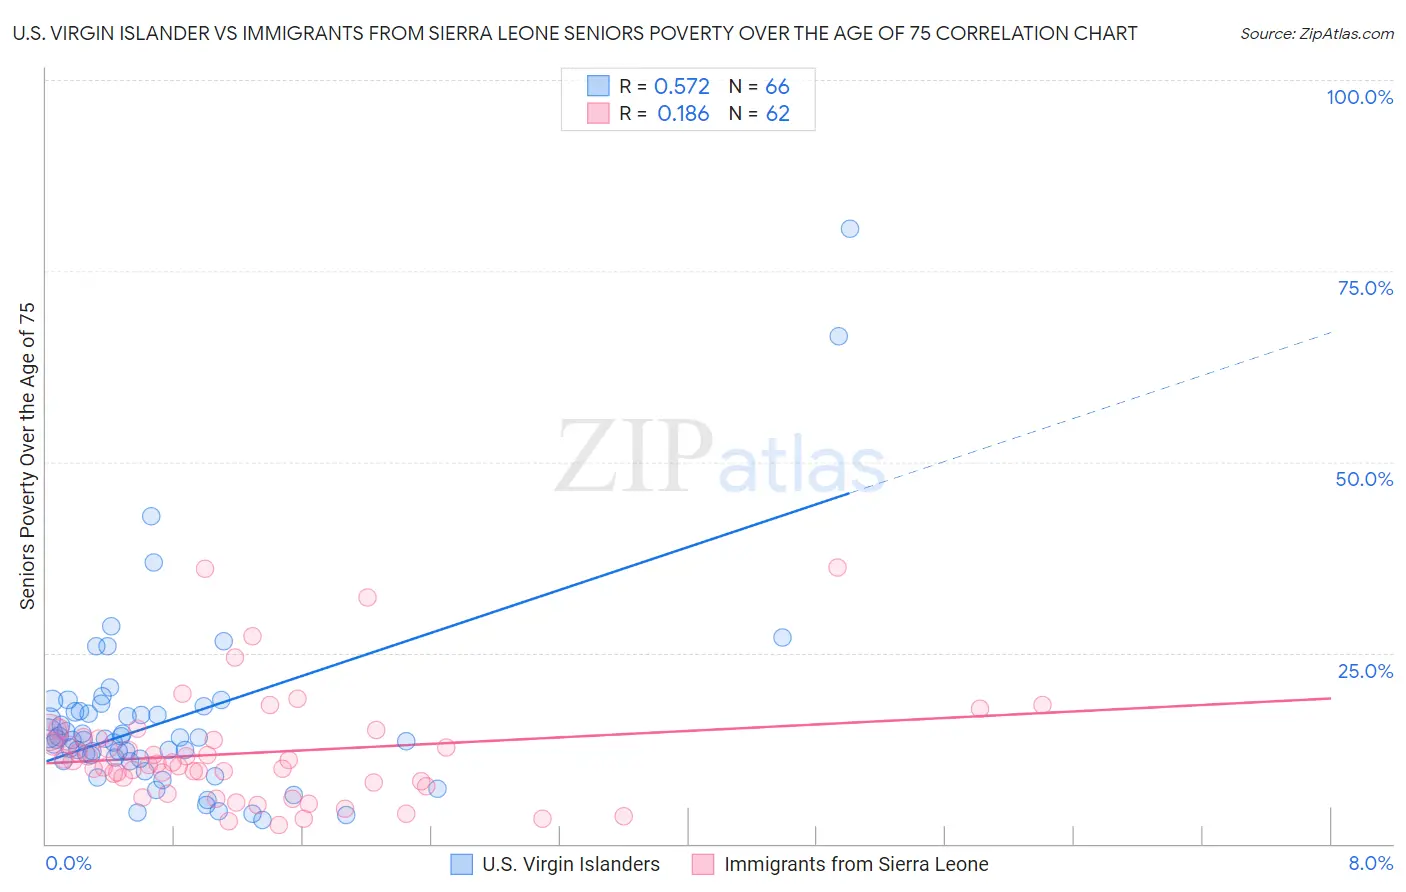
U.S. Virgin Islander vs Immigrants from Sierra Leone Seniors Poverty Over the Age of 75 Correlation Chart
The statistical analysis conducted on geographies consisting of 87,346,721 people shows a substantial positive correlation between the proportion of U.S. Virgin Islanders and poverty level among seniors over the age of 75 in the United States with a correlation coefficient (R) of 0.572 and weighted average of 15.4%. Similarly, the statistical analysis conducted on geographies consisting of 101,208,220 people shows a poor positive correlation between the proportion of Immigrants from Sierra Leone and poverty level among seniors over the age of 75 in the United States with a correlation coefficient (R) of 0.186 and weighted average of 11.9%, a difference of 29.4%.
Seniors Poverty Over the Age of 75 Correlation Summary
| Measurement | U.S. Virgin Islander | Immigrants from Sierra Leone |
| Minimum | 3.0% | 2.4% |
| Maximum | 80.5% | 36.1% |
| Range | 77.5% | 33.7% |
| Mean | 16.3% | 11.9% |
| Median | 13.8% | 10.5% |
| Interquartile 25% (IQ1) | 11.2% | 8.0% |
| Interquartile 75% (IQ3) | 17.3% | 13.8% |
| Interquartile Range (IQR) | 6.1% | 5.8% |
| Standard Deviation (Sample) | 12.6% | 7.2% |
| Standard Deviation (Population) | 12.5% | 7.1% |
Similar Demographics by Seniors Poverty Over the Age of 75
Demographics Similar to U.S. Virgin Islanders by Seniors Poverty Over the Age of 75
In terms of seniors poverty over the age of 75, the demographic groups most similar to U.S. Virgin Islanders are Yuman (15.4%, a difference of 0.18%), Immigrants from Jamaica (15.3%, a difference of 0.19%), Honduran (15.4%, a difference of 0.46%), Apache (15.3%, a difference of 0.64%), and Native/Alaskan (15.5%, a difference of 0.80%).
| Demographics | Rating | Rank | Seniors Poverty Over the Age of 75 |
| Jamaicans | 0.0 /100 | #288 | Tragic 15.1% |
| Immigrants | Belize | 0.0 /100 | #289 | Tragic 15.2% |
| Immigrants | Azores | 0.0 /100 | #290 | Tragic 15.2% |
| Paiute | 0.0 /100 | #291 | Tragic 15.2% |
| Colville | 0.0 /100 | #292 | Tragic 15.2% |
| Apache | 0.0 /100 | #293 | Tragic 15.3% |
| Immigrants | Jamaica | 0.0 /100 | #294 | Tragic 15.3% |
| U.S. Virgin Islanders | 0.0 /100 | #295 | Tragic 15.4% |
| Yuman | 0.0 /100 | #296 | Tragic 15.4% |
| Hondurans | 0.0 /100 | #297 | Tragic 15.4% |
| Natives/Alaskans | 0.0 /100 | #298 | Tragic 15.5% |
| Spanish American Indians | 0.0 /100 | #299 | Tragic 15.5% |
| Bahamians | 0.0 /100 | #300 | Tragic 15.5% |
| Immigrants | Latin America | 0.0 /100 | #301 | Tragic 15.6% |
| West Indians | 0.0 /100 | #302 | Tragic 15.7% |
Demographics Similar to Immigrants from Sierra Leone by Seniors Poverty Over the Age of 75
In terms of seniors poverty over the age of 75, the demographic groups most similar to Immigrants from Sierra Leone are Ugandan (11.9%, a difference of 0.060%), Lebanese (11.9%, a difference of 0.090%), Immigrants from Ireland (11.9%, a difference of 0.16%), Immigrants from Western Europe (11.9%, a difference of 0.25%), and Immigrants from Philippines (11.9%, a difference of 0.30%).
| Demographics | Rating | Rank | Seniors Poverty Over the Age of 75 |
| Pennsylvania Germans | 83.4 /100 | #126 | Excellent 11.8% |
| Immigrants | Denmark | 82.6 /100 | #127 | Excellent 11.8% |
| Immigrants | Hungary | 81.7 /100 | #128 | Excellent 11.8% |
| Ethiopians | 80.7 /100 | #129 | Excellent 11.8% |
| Spanish | 80.5 /100 | #130 | Excellent 11.8% |
| Immigrants | Western Europe | 79.6 /100 | #131 | Good 11.9% |
| Lebanese | 78.3 /100 | #132 | Good 11.9% |
| Immigrants | Sierra Leone | 77.6 /100 | #133 | Good 11.9% |
| Ugandans | 77.1 /100 | #134 | Good 11.9% |
| Immigrants | Ireland | 76.2 /100 | #135 | Good 11.9% |
| Immigrants | Philippines | 75.0 /100 | #136 | Good 11.9% |
| Immigrants | Moldova | 74.1 /100 | #137 | Good 11.9% |
| Immigrants | Romania | 72.6 /100 | #138 | Good 11.9% |
| Immigrants | Kenya | 72.6 /100 | #139 | Good 11.9% |
| Immigrants | Pakistan | 71.9 /100 | #140 | Good 12.0% |